How to create dynamic diagrams in Unified Modeling Language

Edward Jenner from Pexels
The Unified Modeling Language (UML) is a comprehensive, standardized approach to technical diagramming. As I explained in my introduction to UML, before 1997, when the Object Management Group (OMG) adopted the UML standard, there was no unified way to model structural diagrams for designing large enterprise applications. UML provides a way for enterprise architects to visualize their designs that anyone who knows UML can understand.
My introductory article answers essential questions like: What is UML? Why was UML created? Who created UML? and Why should you use UML? There are two basic types of UML diagrams: static and dynamic. In this article, I go into the details of dynamic diagrams, and in another article, I explain static diagrams.
Each example diagram for this article represents a particular aspect of a hypothetical application called the Instructional Video Service. That application is a system that delivers an educational video to a user according to a selection made from a catalog of videos available for viewing.
Types of dynamic diagrams
Dynamic UML diagrams describe the behavior of systems. A dynamic diagram describes the operations, actions, and changes that occur in a system over time. A static diagram, on the other hand, describes the characteristics of a system or part of a system.
UML specifies seven types of dynamic diagrams:
The following sections describe the details of each type of dynamic diagram.
Activity
An activity diagram describes the flow of actions in a system or subsystem. Also, an activity diagram can describe simultaneous activities, decision points, and subsequent behavior based on the decision's result. Activity diagrams are perfect for describing how a system operates on a step-by-step, condition-by-condition basis.
Activity example
Figure 1 is an activity diagram describing the flow of activities executed in an instructional video website.

The diagram describes a user logging into the site and being subjected to verification at a decision point. Suppose the user is known to the system. That user is then allowed to view a list of videos on a catalog page. Otherwise, the user is redirected to an Unknown User page. The Unknown User page provides the option to sign up for the service. (The sign-up option is implicit and not illustrated in the diagram.)
The user selects a video to view. At that point, the activity diagram describes a set of simultaneous actions on the webpage: playing the video while also displaying the video catalog where a user can select another video to view, which interrupts the current video running.
[ Learn how to design your enterprise architecture for the future. Download the free eBook Event-driven architecture for a hybrid cloud blueprint. ]
At any point during the viewing process, the user can log out of the website. The process ends.
Activity symbols
Figure 2 describes the symbols used in the activity diagram illustrated in Figure 1.

Use case
A use case diagram describes, as its name implies, how an actor or artifact uses a system. A use case diagram can also describe how one action or component uses another. A use case diagram is very good for describing various behaviors in a system and who or what controls that behavior.
Use case example
The use case diagram in Figure 3 describes an instructional video system. The instructional video system is the example scenario used throughout this article series.
The diagram illustrates two actors:
- Learner: A human
- Authentication server: A component
All cases in the system are displayed within a rectangle that describes the boundaries of the system. Actors use the system. Thus, they are placed outside the rectangle, illustrating the system boundary. The same is true of the Authentication Server.
Use case diagrams have a symbol that describes a separate action required by a particular action. This is the line that has the text <<include>>. In the use case below, the Login action needs to use the Verify Login Credentials to execute its intended task.
Also, use case diagrams have a symbol that describes how an action can enhance the behavior of another action. The line symbol describes this with the text <<extend>>. In the use case below, displaying an error page extends the behavior of Login. While showing an informative error page is a wise choice in application design, it's not essential to the Login action. One might use another action. Hence, it's deemed an extended behavior.
Finally, in Figure 3 below, the Play Training Video has two associated actions: Play from Beginning and Resume Play. In UML terminology, Play Training Video is an abstract use; hence, its name is in italics. It needs concrete behavior to be operational. Play from Beginning and Resume Play are the concrete implementations of that abstraction. It's a subtle point, but readers sophisticated in object-oriented programming details might find the distinction appropriate.

Use case symbols
Figure 4 describes the symbols used in the use case example (Figure 3).

State machine
A state machine diagram describes the characteristics of a system as it changes in response to an event. As a system changes, it moves from one state to another.
State machine example
Figure 5 is an example of a UML state machine diagram. The diagram describes the various states of a Video Viewer system, showing four states: Ready, In Progress, Pause, and Finish. State change is instigated by an event that's described as a line with an arrowhead pointing to the state that is the event's target.
UML specifies that a state can have a set of internal actions that set system characteristics and internal behavior accordingly. These internal actions are entry, do, and exit. Some implementations of the UML state diagram use these internal actions; some do not. Or, some will describe the entry and exit actions and omit the do action. Given the variety of implementations, deciding whether to use entry, do, and exit actions seems to be a matter of style. The state diagram in Figure 5 describes the entry, do, and exit actions for each state.
Regardless of whether the entry, do, and exit actions are illustrated, the most important thing about a state diagram is that it describes the various states a system can be in.

State machine symbols
Figure 6 describes the symbols used in the state diagram in Figure 5.

Sequence
A UML sequence diagram describes the flow of tasks between particular actors or components and their lifelines.
Sequence example
Figure 7 describes the login process to the InstructionVideo system in terms of a sequence diagram.
Important concepts to understand about a sequence diagram are the notions of delegation, action, and reaction. In a sequence diagram, you can delegate one action to another action.
Notice in Figure 7 that the User executes a login task against the browser. In turn, the browser delegates the login action to the web server as an authentication action. Then, that authentication action is delegated further along the sequence to the authentication server. Finally, the authentication server processes the authentication action and reacts with an OK response. Actions are illustrated using a solid line. Reactions are illustrated using a dotted line.
Sequence diagrams also support conditional behavior. A conditional sequence is illustrated within a bounded frame called an alternative frame. Notice in Figure 7 that the login sequence is bounded in an alternative frame. If the login is successful, the user is shown a video catalog. If the login fails, the user is shown a sign-up page. The positive response is separated from the negative response by a dotted line.
Another symbol commonly used in a sequence diagram is the activation timespan bar. The activation timespan bar describes how long an actor or component participates in the sequence of events. The diagram below shows that the browser is active throughout the sequence of events, while the application server and media servers are active for only a portion of the sequence. Activation timespan bars are useful for describing at a glance the level of activity of a given component within a system throughout the lifetime of the sequence.

Sequence symbols
Figure 8 describes the UML symbols used in the sequence diagram in Figure 7.

Communication
The UML communication diagram describes how messages get exchanged between components in a system. A communication diagram also describes how one component is associated with another component. Messages are described using lines with arrowheads. An association between two components is described using a line without any arrowheads.
Communication example
Figure 9 is an example of a communication diagram that describes the messages sent to the components that make up the InstructionalVideo scenario.
An interesting aspect of the communication diagram is the numbering convention that groups together messages sent among components. The format used in the numbering convention is #.#.n, where the period character is a delimiter that indicates a message is in a subordinate group to another.

Notice in Figure 9 that messages are numbered as follows:
- 1 login(username, pwd)
- 1.1 validate(username=username, pwd=pwd)
- 1.2 validate(username=username, pwd=pwd)
Message 1 is sent by the User to the user interface (UI) component, most likely a browser. The UI sends message 1.1 to the Application, and message 1.2 is sent by the Application to the Authentication component. The important thing to notice is that all of the 1.X messages relate to validation and behavior after validation. Thus they are labeled according to the extended numbering convention.
Since the selectVideo(videoID) message never goes beyond the UI component, its number label is 2 only. Yet, since the messages related to playing a video propagate from the User to the UI and onto the VideoStreamer component, those messages are labeled using the extended numbering convention, for instance 3 and 3.1.
[ Take the free online course: Developing cloud-native applications with microservices architectures. ]
Communication symbols
Figure 10 describes the symbols used in the communication diagram shown in Figure 9.

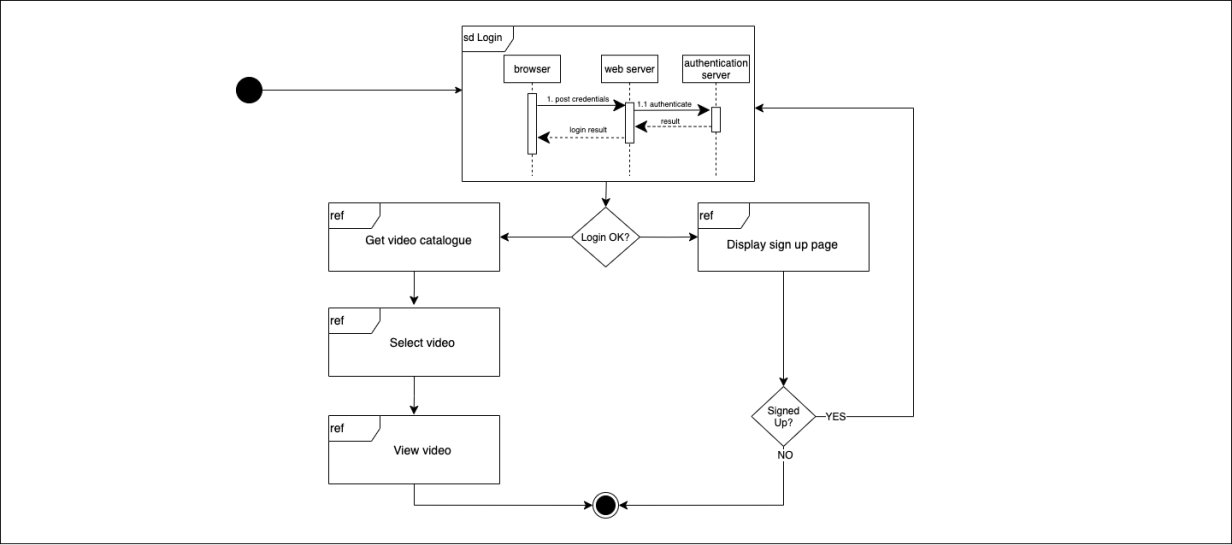
Interaction overview
An interaction overview diagram describes the interaction between components in a system. An interaction overview diagram describes two types of interaction frames. One interaction frame indicates that the frame contains the details of an interaction. This type of interaction frame has the label sd as a prefix to the component's name in the upper-left corner.
The other interaction frame indicates that the frame references an interaction with its details described elsewhere. You name this type of interaction frame with the label ref in the upper-left corner.
An interaction diagram supports describing decision points.
Interaction overview example
Figure 11 is an example of an interaction overview diagram that describes interactions that are part of the InstructionalVideo scenario. Notice that there are five points of interaction: Login, Display sign up page, Get video catalogue, Select video, and View video. There is also one decision point, Login OK?
The interaction for Login is defined with an sd prefix. Thus, it provides a good amount of details about the Login process. The other interactions are defined with the ref label. These interaction frames describe what the interaction does, but not how it does it. Those details are defined in other diagrams.
Interaction overview symbols
Figure 12 describes the symbols used in the communication diagram in Figure 11.

Timing
A timing diagram describes how events in a process execute over time. A timing diagram is similar to a sequence diagram, but it describes the time for events to execute in and among components. You can describe timespans absolutely or relatively.
Timing diagrams help describe the actual or expected amount of time it takes for activities to execute within and among processes. A timing diagram can help identify bottlenecks when analyzing performance behavior, even at a conceptual level.
Timing example
Figure 13 is an example of a timing diagram for the high-level video viewing process that is part of the Instructional Video system used throughout this article.
Notice that the diagram describes the process of viewing a catalog of videos, selecting a video to view, and then viewing the video. The overall process is executed by a Web User and three artifacts:
- Browser
- Web Server
- Media Server
The actor and the artifacts are each enclosed in their own swimlane.
At the bottom of the diagram are a series of vertical lines distributed equally along an x-axis. These ticks on the x-axis represent the units of time against which you will measure activity. Some timing diagrams use actual units of time, such as seconds, minutes, or hours. Others, such as the diagram below, segment time according to a general, undefined unit.
The left side of a swimlane lists the activities executed by an actor or artifact, in ascending order, from bottom to top. The right side of the swimlane shows each activity unfolding over time. A horizontal line describes the length of time it takes for an activity to execute on the left side of the swimlane.
The horizontal lines in the Web User and Browser swimlanes appear as parts of a step pattern. The horizontal lines in the Web Server and Media Server swimlanes are part of an up and down pattern. The Web User and Browser swimlanes describe a continuous activity, hence the ascending step pattern. The activities in the Web Server and Media Server swimlanes are episodic. The episodic patterns start, execute for some time, and then stop, hence the up and down pattern.
Notice that each horizontal timespan line is assigned a label that describes the length of the timespan. Also, notice that vertical lines have arrowheads that point from the timeline in one swimlane to another timeline in another swimlane. A vertical line with an arrowhead describes a correlation of one swimlane's timeline to another. For example, notice that the vertical line with the arrowhead in the Browser swimlane for the Video playing action, at the timespan label, (t… t+n) points to the Video streaming timespan in the Media Server swimlane at the same point of execution. This means both the Browser and the Media Server are active simultaneously.

Timing symbols
Figure 14 describes the symbols used in the timing diagram in Figure 13.

Conclusion
UML is a very detailed set of diagram types and symbols, but those details are what make the standard a standard. When enterprise architects use a common diagramming language, any developer in any company is able to work on any system designed by any architect. For more details about UML dynamic diagrams, you can read the specification at uml.org.


Bob Reselman
Bob Reselman is a nationally known software developer, system architect, industry analyst, and technical writer/journalist. More about me
Navigate the shifting technology landscape. Read An architect's guide to multicloud infrastructure.
Related Content


OUR BEST CONTENT, DELIVERED TO YOUR INBOX