Red Hat Blog
Red Hat Ceph Storage is popular storage for Red Hat OpenStack Platform. Customers around the world run their hyperscale, production workloads on Red Hat Ceph Storage and Red Hat OpenStack Platform. This is driven by the high level of integration between Ceph storage and OpenStack private cloud platforms. With each release of both platforms, the level of integration has grown and performance and automation has increased. As the customer's storage and compute needs for footprints have grown, we have seen more interest towards running compute and storage as one unit and providing a hyperconverged infrastructure (HCI) layer based on OpenStack and Ceph.
HCI is becoming increasingly common for private cloud and network function virtualization (NFV) infrastructure core and edge workloads. HCI platform offers co-located, software-defined compute and storage resources, as well as a unified management interface, all running on industry-standard, commercial off-the-shelf (COTS) hardware. Red Hat Hyperconverged Infrastructure for Cloud (RHHI-C) combines Red Hat OpenStack Platform and Red Hat Ceph Storage into one offering with a common life cycle and support.
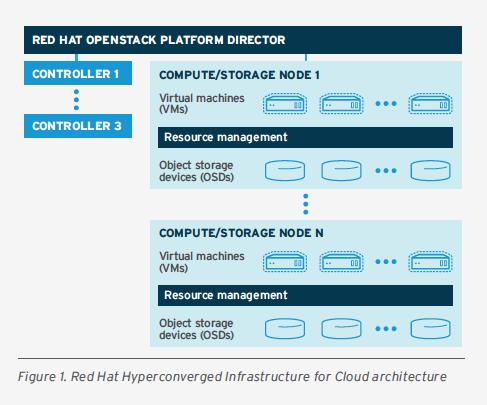
Implementing a hyperconverged solution raises key questions, such as:
-
What is the performance impact when moving from decoupled infrastructure (Red Hat Ceph Storage and Red Hat OpenStack Platform running as two independent pools of servers) to hyperconverged infrastructure?
-
Can you reduce hardware footprint (number of servers) with hyperconvergence without sacrificing performance?
-
If so, what hardware and software configuration achieves performance parity between decoupled and hyperconverged infrastructure?
With the goal of answering these questions, the Storage Solution Architectures Team at Red Hat Hyperconverged Business Unit performed several rounds of testing to collect definitive, empirical data. We would like to thank DellEMC for providing us the lab hardware necessary for this project.
In this two-part blog series, we’ll share insights into our lab environment, testing methodology, performance results, and overall conclusions. The purpose of this testing was not to maximize performance by extensive tuning or by using the latest, best-of-breed hardware but to compare performance across decoupled and hyperconverged architectures. Further, we wanted to test BlueStore, the new Ceph OSD backend.
Test environments
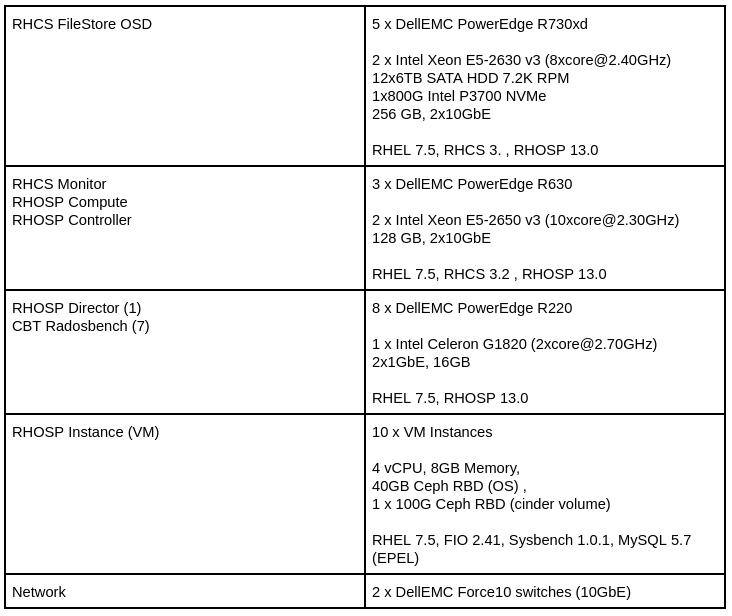
Configuration 1: Red Hat OpenStack Platform decoupled architecture with standalone Red Hat Ceph Storage FileStore OSD backend
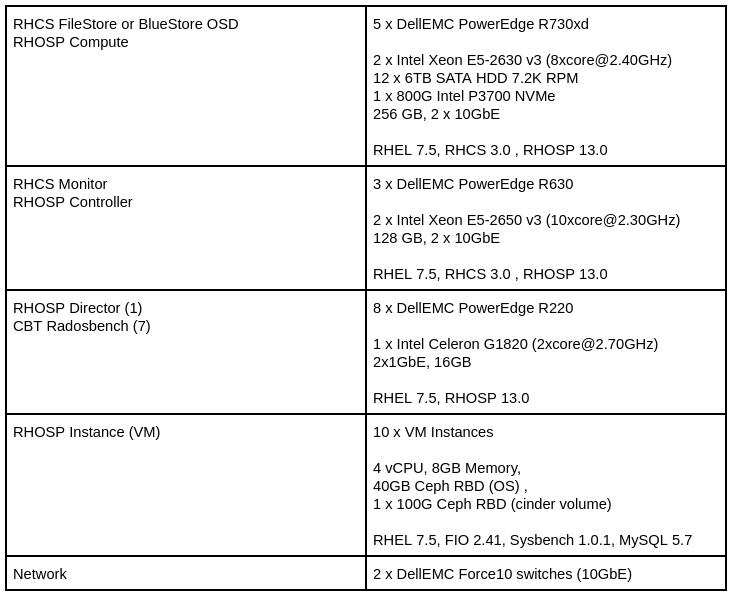
Configuration 2: Red Hat OpenStack Platform hyperconverged architecture with Red Hat Ceph Storage FileStore OSD backend using RHHI for Cloud
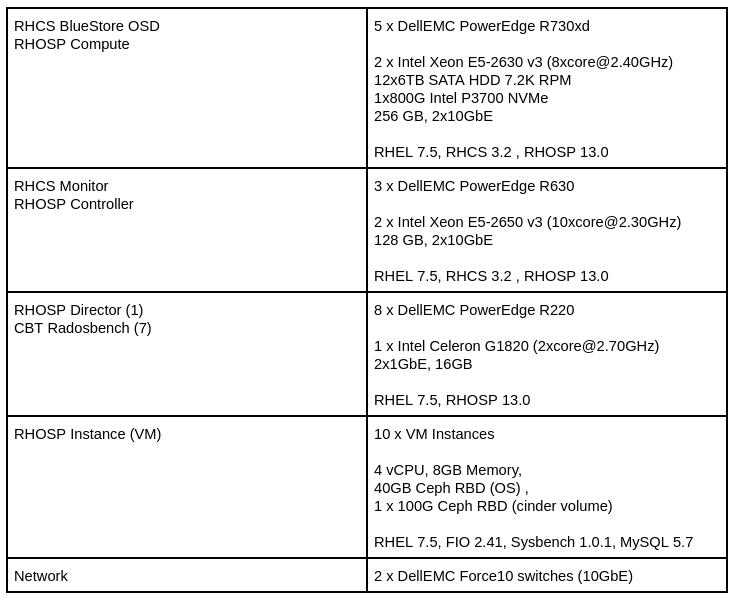
Configuration 3: Red Hat OpenStack Platform hyperconverged architecture with Red Hat Ceph Storage BlueStore OSD backend using RHHI for Cloud
Testing methodology
To understand the performance characteristics of Ceph between decoupled (standalone) and hyperconverged (Red Hat OpenStack Platform co-resident on Red Hat Ceph Storage server nodes) implementations, we performed multiple iterations of MySQL database tests with coverage to 100% read, 100% write, and 70/30 read-write mix database queries. The results were evaluated in terms of database transactions per second (TPS), queries per second (QPS), average latency, and tail latency. These results will be documented in Part 2 of this series.
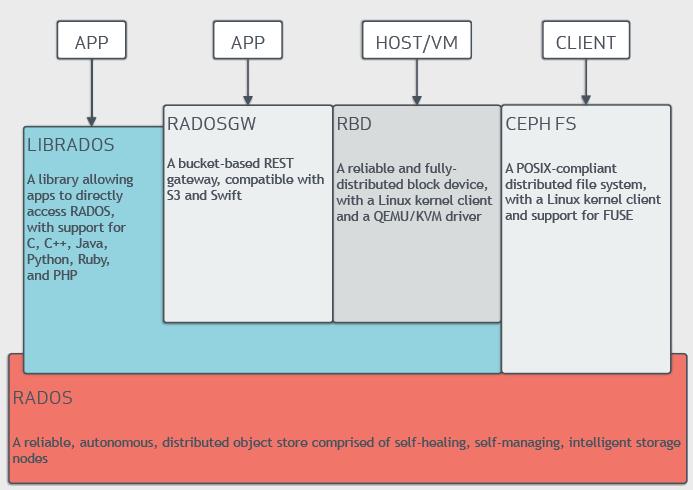
Figure 2: Ceph I/O interfaces (source)
Before performing database workload testing that used higher-level Ceph protocols like RBD, Red Hat executed a series of simple performance tests using the radosbench tool to establish known performance baselines for storage subsystems.
The performance benchmarking was done on the three following configurations:
-
Red Hat OpenStack Platform decoupled architecture with standalone Red Hat Ceph Storage FileStore OSD backend
-
Red Hat OpenStack Platform hyperconverged architecture with Red Hat Ceph Storage FileStore OSD backend using RHHI for Cloud
-
Red Hat OpenStack Platform hyperconverged architecture with Red Hat Ceph Storage BlueStore OSD backend using RHHI for Cloud
Ceph baseline performance using rados bench
To record native Ceph cluster performance, Ceph Benchmarking Tool (CBT), an open source tool for automating Ceph cluster benchmarks, was used. CBT is written in Python and takes a modular approach to Ceph benchmarking. For more information on CBT, visit GitHub.
Baseline testing was done with default Ceph configurations in a decoupled environment, and no special tunings were applied. Seven iterations of each benchmark scenario were run. The first iteration executed the benchmark from one client, the second from two clients, the third from three clients in parallel, and so on. For Ceph baseline performance test, the following CBT configuration was used:
-
Workload: Sequential write and Sequential read
-
Block Size: 4MB
-
Runtime: 300 seconds
-
Concurrent threads per client: 128
-
RADOS bench instance per client: 1
-
Pool data protection: 3x Replication
-
Total number of clients: 7
The goal of Ceph baseline performance testing was to find the maximum aggregate throughput (the high watermark) for the cluster. This is the point beyond which performance either ceases to increase or drops.
Understanding BlueStore Ceph OSD backend
BlueStore is the next version of backend object store for the Ceph OSD daemons. The original Ceph object store, FileStore, requires a file system on top of raw block devices. Objects are then written to the file system. Unlike the original FileStore back end, BlueStore stores object directly on the block devices without any file system interface, which improves the performance of the cluster. To learn more about BlueStore review the Red Hat Ceph Storage documentation.
 Figure 3(a): Ceph FileStore implementations.
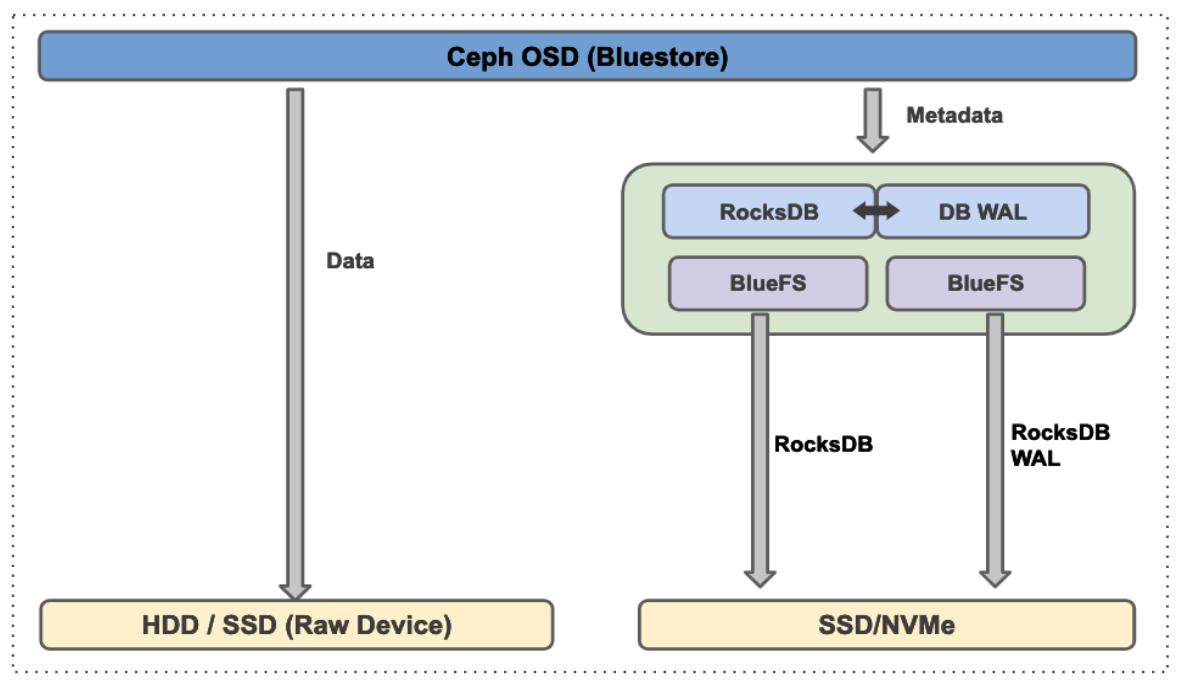
Figure 3(b): Ceph BlueStore implementations.
FileStore vs. BlueStore performance comparison
The following graphs show top-line 4MB cluster aggregated performance across five storage nodes with 60 OSDs with 7 clients.
-
Write throughput: BlueStore OSD backend showed approximately 2234 MB/s throughput with roughly 42% increase over FileStore performance until limited by disk drive saturation (see the appendix to this post for subsystem metrics). Because BlueStore brings low-level architectural improvements to Ceph OSD, out-of-the-box performance improvements could be expected. The performance could have been scaled higher had we added more Ceph OSD nodes.
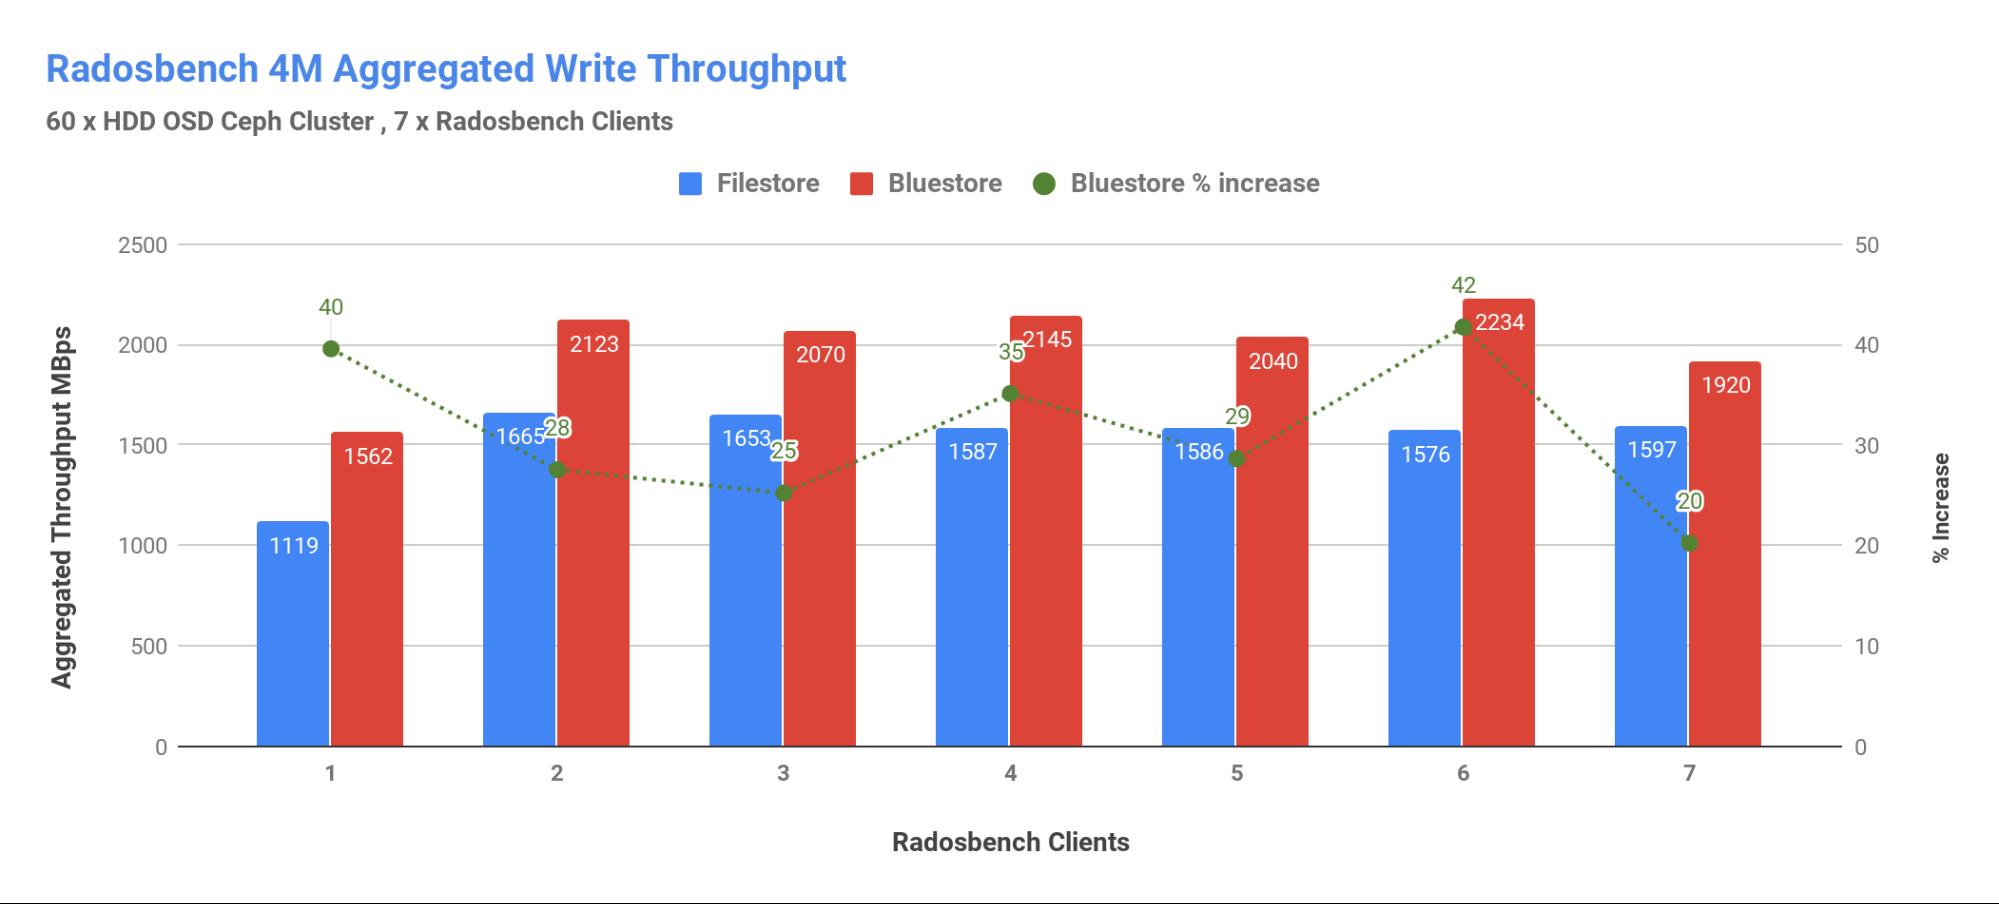
Figure 4: Write throughput
-
Read throughput: With a low number of parallel clients, BlueStore delivered higher performance. As the number of clients increased, however, BlueStore performance stayed consistent until FileStore performance reached parity. To understand this read performance better, we need to dig deeper into FileStore and BlueStore memory usage.
A FileStore backend uses XFS, which means the Linux kernel is responsible for memory management, caching data, and metadata. In particular, the kernel can use available RAM as a cache and then release it as soon as the memory is needed for something else. Because BlueStore is implemented in userspace as part of the OSD, Ceph OSD itself manages its own cache and thus can have lower memory footprint according to the following tunable parameters.
Red Hat Ceph Storage 3.2 introduces new options for memory and cache management, namely osd_memory_target and bluestore_cache_autotune that helps BlueStore backend to auto adjust its cache and efficiently use memory to cache more metadata thus expected to deliver better read performance, see Red Hat Ceph Storage documentation for more details about this feature.
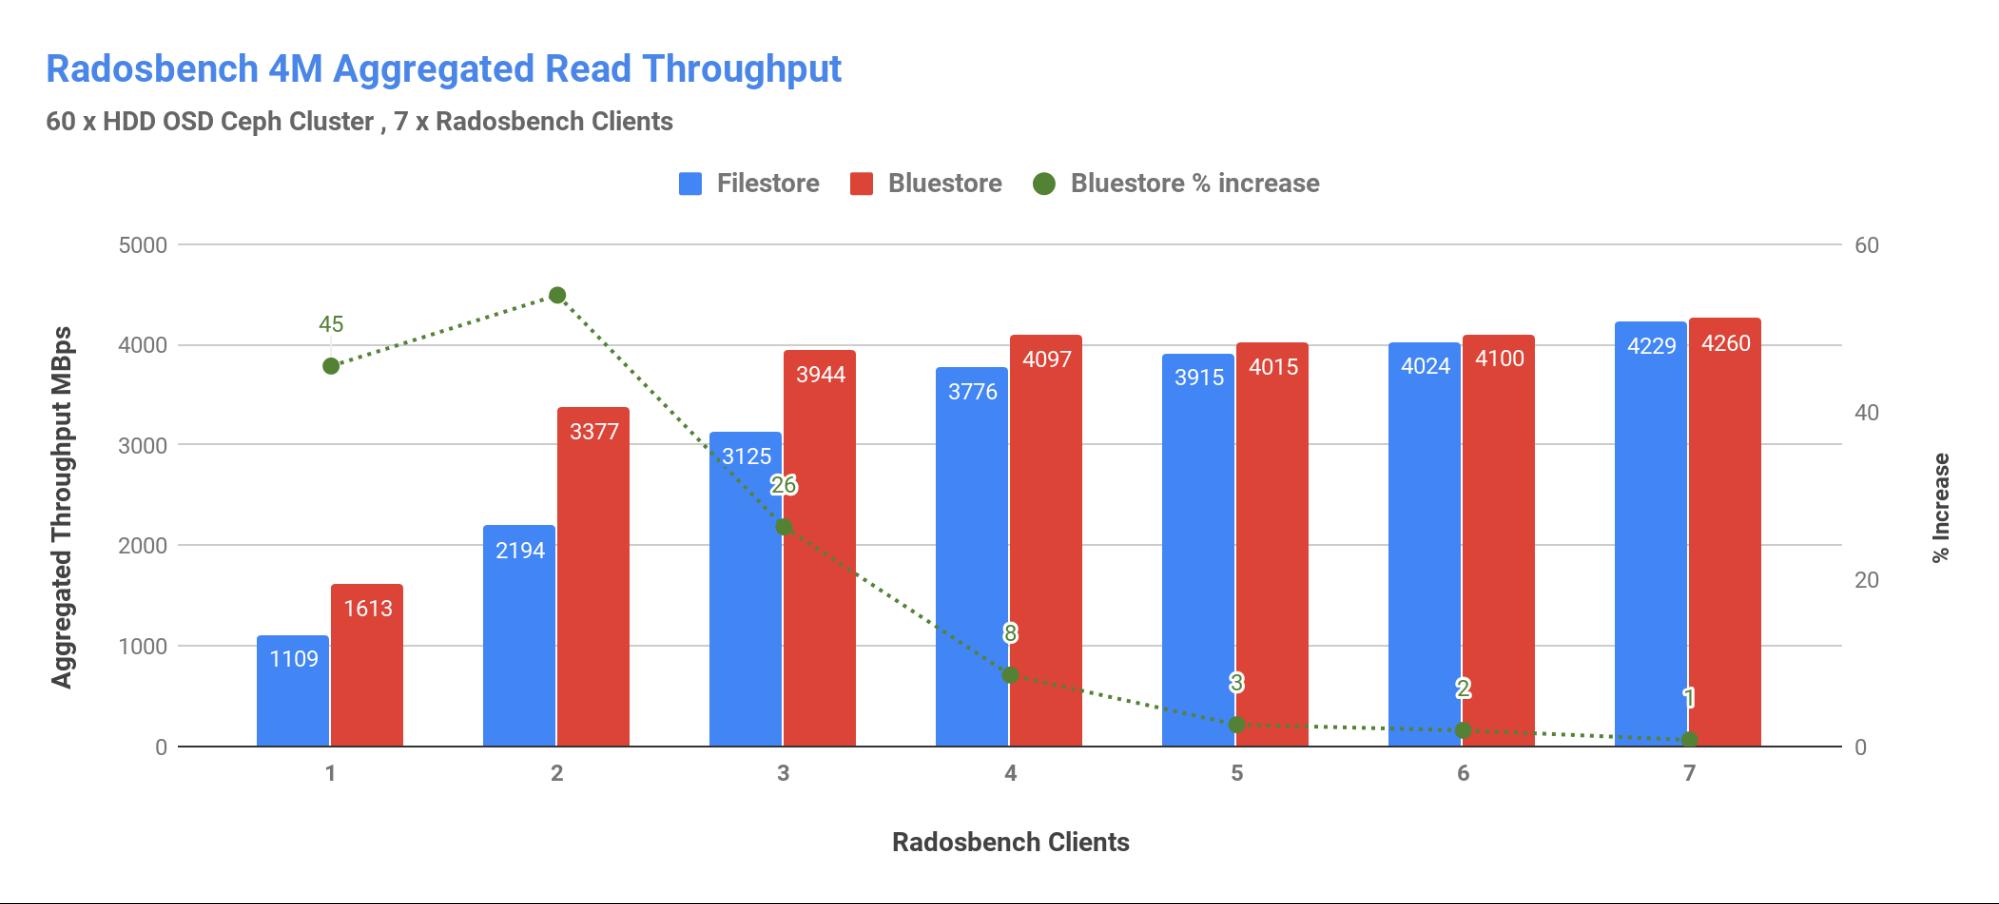
Figure 5: read throughput
Appendix
The Subsystem metrics captured during HCI BlueStore test show spinning media performance was limited by disk saturation for 4M radosbench write workloads. The high peaks in the figure-6 represent 100% write large object size workload. Following the peak in each sequence are the metrics for the 100% read large object size workload, reflecting no OSD hardware bottlenecks for 4M read workloads.
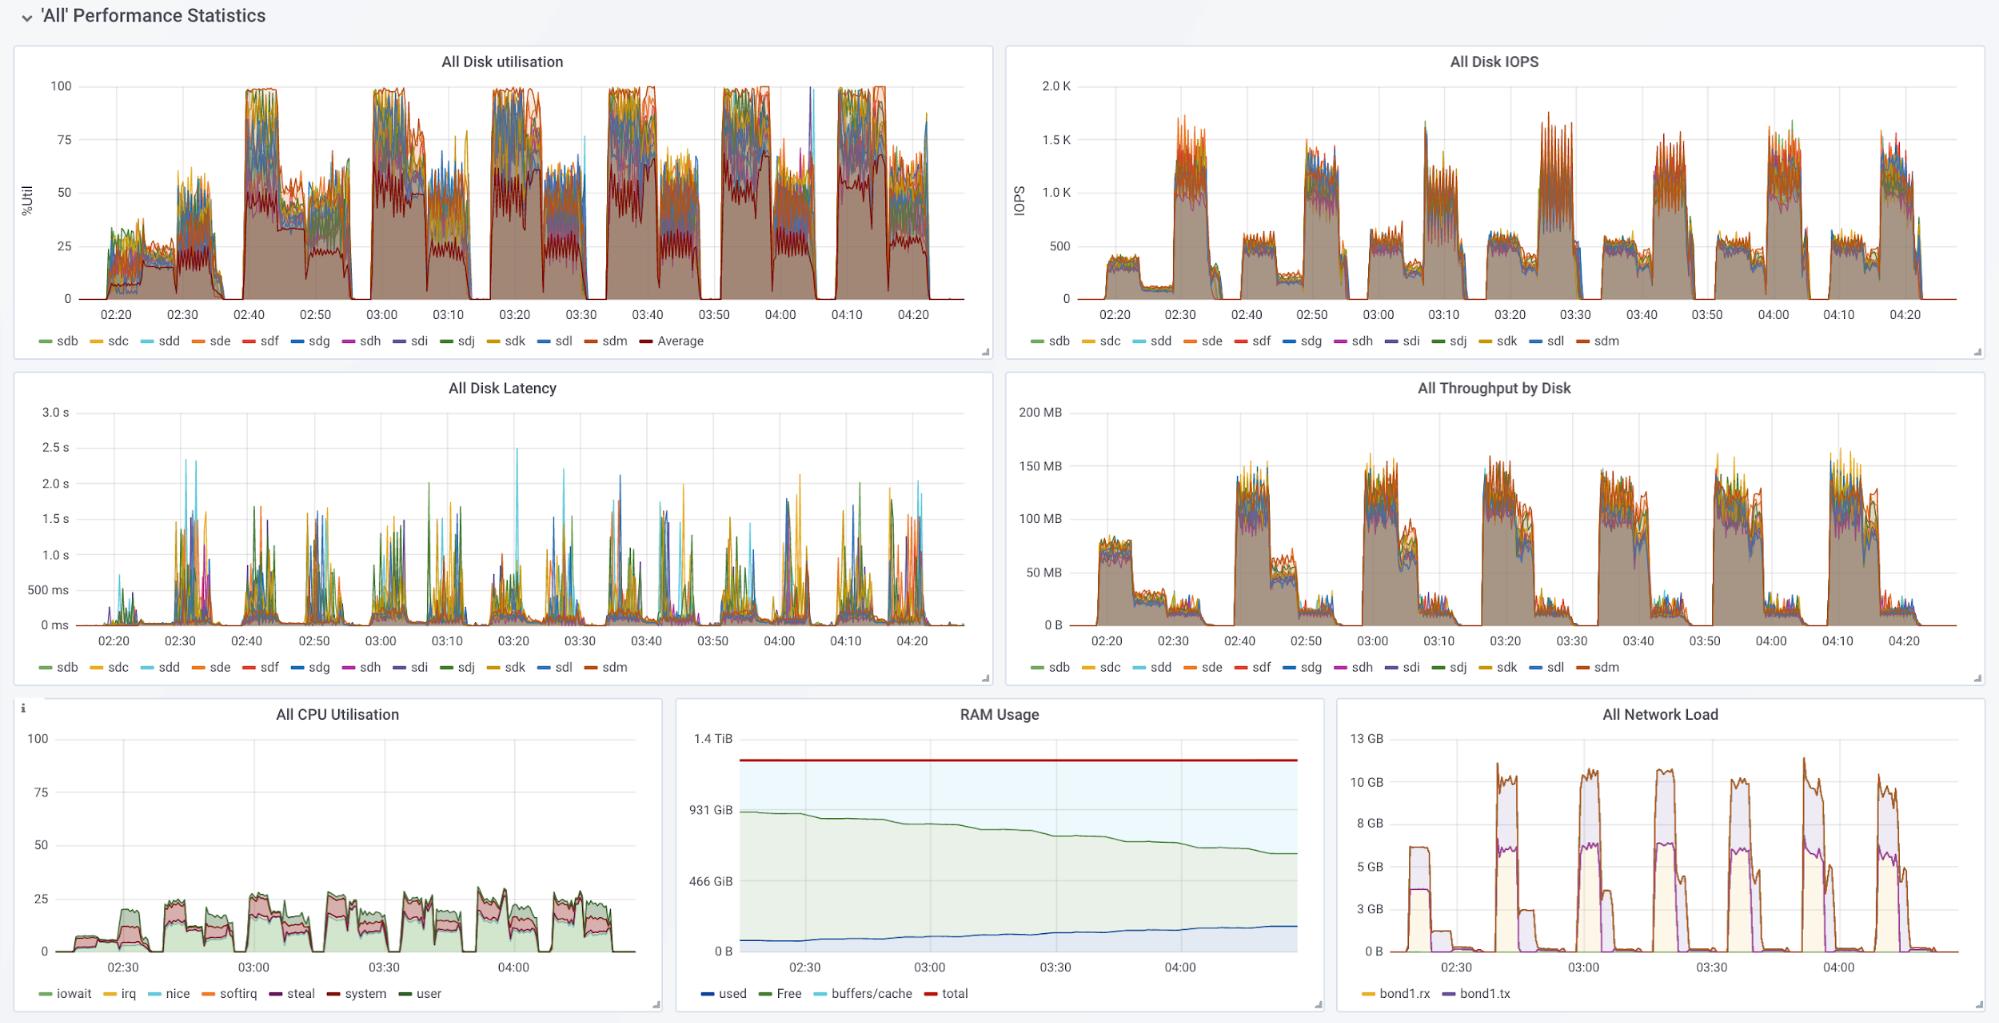 Figure 6: Disk utilization and disk latency
Up next
Continuing the benchmarking series, in the next post you’ll learn performance insights of running multi-instance MySQL database on Red Hat OpenStack Platform and Red Hat Ceph Storage across decoupled and hyperconverged architectures. We’ll also compare results from a near-equal environment backed by all-flash cluster nodes.
