
The first step to solving performance issues is being able to diagnose the issue. If you don’t have performance metrics and the ability to analyze them, you’re just relying on guesswork. One of the popular tools for performance monitoring on Linux is Performance Co-Pilot (PCP), and we’ll show you how to get started using PCP on Red Hat Enterprise Linux to collect and analyze data to solve your performance mysteries.
What is performance monitoring?
There are at least two kinds of monitoring:
-
Availability monitoring: is a system or a service available?
-
Performance monitoring: what are the current numbers on my systems, i.e. load or network throughput?
In this post we will see how PCP can be used for performance monitoring to solve everyday issues. In a later article we will investigate monitoring of custom metrics, for example data from applications, with PCP.
Why PCP and not tool XYZ?
Details on how PCP tools relate to legacy tools are here. Let’s consider some current frameworks:
-
Sar has been available for ages on Red Hat Enterprise Linux for recording performance data. While simple to use, it comes with challenges like the sar archive files being tied to the sar version, so to analyze a sar archive file, you need to install the exact sar version which was used for recording.
-
Collectl is a nice and slim Perl script which covers some use cases, but lacks the flexibility of the more advanced tools.
-
Performance Co-Pilot (PCP) is our recommended solution to record performance data on Red Hat Enterprise Linux. Since PCP has been around for over 20 years, many Performance Metrics Domain Agents (PMDAs) have been written - these are agents for collecting performance data from various sources on a system. PCP is part of the normal Red Hat Enterprise Linux 6 and 7 repos, it comes with many tools to analyze (pmdiff etc.) and present (pmchart, pmrep and so on) recorded data. On Red Hat Enterprise Linux 7, PCP performance data is also part of sosreports.
-
Prometheus is a quite new backend for storing metrics. Its good integration with Kubernetes brought it into OpenShift 3.10 as Tech Preview. Prometheus also comes with alerts (i.e. “warn me if load is high”) and trend analysis.
-
Netdata is also quite new, it focuses on direct visualization of performance data.
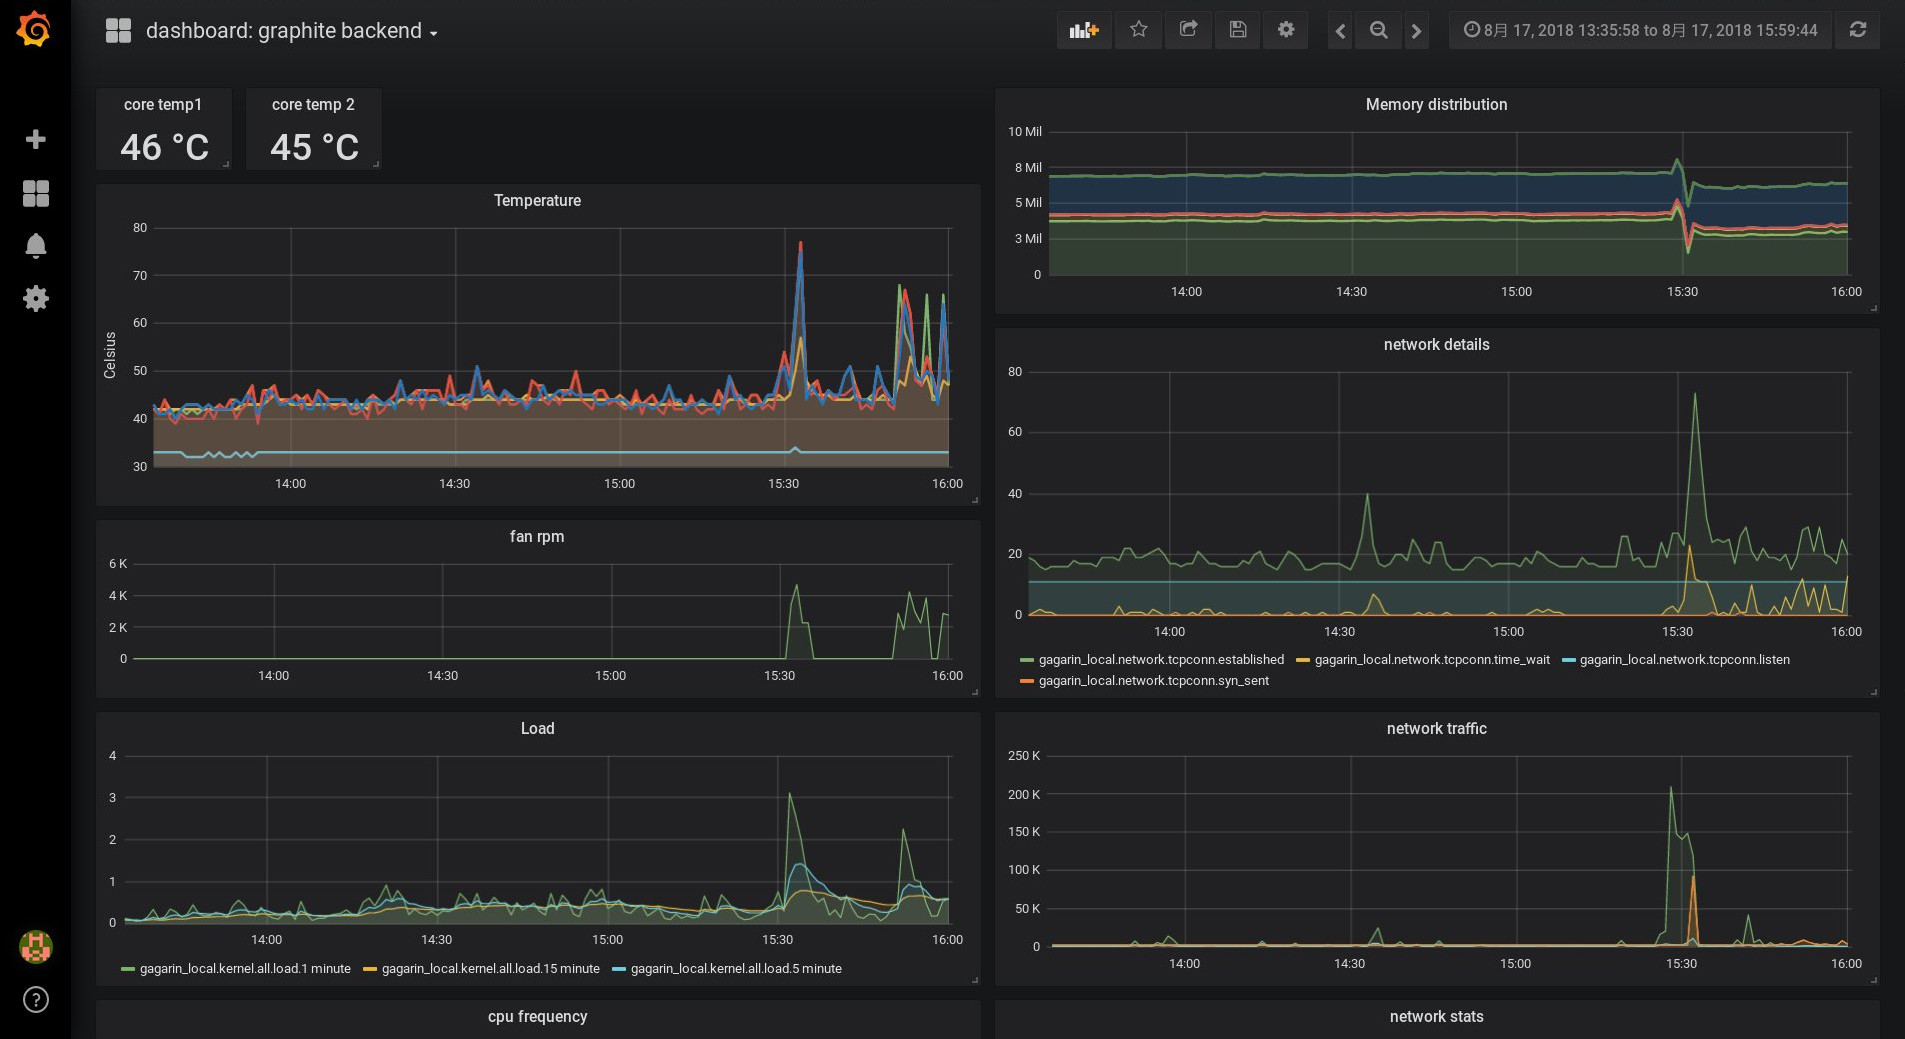
Visualized PCP metrics via graphite/grafana can look like this:
Our basic PCP installation
While the PCP packages are part of the normal Red Hat Enterprise Linux repos, we will additionally use the ‘pcp-zeroconf’ package from the optional channel. It will configure monitoring of basic system metrics for us. We start with activating the optional repo:
# subscription-manager repos --enable=rhel-7-server-optional-rpmsPCP components are spread over several packages, allowing you to install just what you really need. Use yum search pcp to list the PCP packages. The pcp-zeroconf package will pull in some of these packages via dependencies.
# yum install pcp-zeroconf pcp-system-toolsAs part of the installation, some components have already been configured and started, they can be seen in the output of ‘ps axf’:
-
The pmcd daemon works as communication central.
-
PMDA's are used by pmcd to monitor performance data (metrics).
-
pmlogger is used to archive performance data.
We additionally installed the pcp-system-tools package, it provides convenient tools to access performance data. That’s all, with these commands the system is now already monitoring performance data to directory /var/log/pcp/pmlogger!
How to access the performance data?
What can we do now with this? At this point, we can run
# pminfoand get an idea about the metrics which PMDA is currently monitoring. This command is purely communicating with the pmcd daemon, not accessing archived data on the disk. Parameters ‘-fT’ also show help and the current value of the metric, if available.
Pcp-zeroconf has configured pmlogger to archive data below /var/log/pcp/pmlogger/<hostname>. Files ending with ‘0’ in that directory are archive files, with the following command we can verify which metrics are getting archived:
# pminfo -a <archivefile> | lessThe additional ‘-a’ is instructing pminfo to use the archive file.
To access data from the currently available kernel.cpu.* metrics on the system use:
# pmrep kernel.cpuIn addition, we have access to the same data from an archive file, if pmlogger is configured to record these metrics:
# pmrep -a <archivefile> kernel.cpu
Users can also construct views of the PCP metrics they are most interested in. For example, the atop utility was resembled using PCP metrics. Command pcp atop can be used to get a view comparable to the atop view, but using metrics from PCP. The pcp iostat command provides I/O data.
The archives from PCP allow us additional flexibility - accessing archived performance data with the atop view. After receiving a call like ‘we had performance issues on system XYZ around 10:40’ you can log onto that system or transfer the PCP archive file from there, and use
# pcp atop -r <archivefile> -b 10:40to look at the atop output of the system, with the data from 10:40.
Which metrics are important?
Let’s imagine we get a report about an issue on a system around 10:40. We fetch the PCP archive file, and investigate. How many metrics are in this archive?
[chris@rhel7u5a ~]# pminfo -a 20180815.09.28.0|wc -l
606
[chris@rhel7u5a ~]#
We see 606 metrics for a default Red Hat Enterprise Linux 7.5 deployment, and more than thousand on Red Hat Enterprise Linux 7.6!
We will need help to find out which metrics are the interesting ones to investigate. In other words, which metrics have been different around 10:40? ‘pmdiff’ may help us here. We will specify a timeframe where the system acted normal with the -S and -T parameters, and a timeframe where the issue occurred with -B and -E.
[chris@rhel7u5a ~]# pmdiff -S 09:30 -T 10:30 -B 10:39 -E 10:42 20180815.09.28.0
20180815.09.28.0 20180815.09.28.0   Ratio  Metric-Instance

09:30-10:30 10:39-10:42
   0.000  0.055	  |+|    kernel.percpu.cpu.user ["cpu2"]
   0.001  0.203   >100   kernel.percpu.cpu.sys ["cpu2"]
   0.005  0.251  50.20   kernel.all.cpu.sys
   0.002  0.068  34.00   kernel.all.cpu.user
   0.002  0.068  34.00   kernel.all.cpu.vuser
   0.001  0.034  34.00   kernel.percpu.cpu.sys ["cpu1"]
   0.004  0.099  24.75   kernel.all.load ["1 minute"]
   0.810  18.75  23.15   xfs.perdev.allocs.free_block ["/dev/mapper/root"]
   11906  197904 16.62   xfs.perdev.xstrat.bytes ["/dev/mapper/root"]
   2.919  48.32  16.55   xfs.perdev.allocs.alloc_block ["/dev/mapper/root"]
   26.88  270.0  10.04   kernel.percpu.intr ["cpu2"]
   0.001  0.009   9.00   kernel.percpu.cpu.user ["cpu1"]
   0.002  0.014   7.00   kernel.percpu.cpu.sys ["cpu3"]
   [..]
Looks like the cpu was busy at that time, also the filesystem. Let’s find out more about processes at that time.
[chris@rhel7u5a ~]# pminfo -T -a 20180815.09.28.0 proc|lessMetrics proc.runq.runnable and proc.runq.blocked look interesting:
@rhel7u5a ~]# pmrep -a 20180815.09.28.0 -S @10:41:15 -T @10:43:18 \
      -p proc.runq.runnable proc.runq.blocked | less

      	p.r.runnable  p.r.blocked
             	count    	count

10:41:15 	2        	0
10:41:16 	2        	0
10:41:17 	3        	0
10:41:18 	3        	0
10:41:19 	3        	0
[..]
10:43:15 	3        	0
10:43:16 	3        	0
10:43:17 	2        	0
10:43:18 	2        	0
Looks like we usually have two runnable processes on the system, but at the time of the issue three were running, and disappearing after some minutes. Pmlogger is also archiving lists of all processes for us. When running ‘pminfo -T proc’, we have seen metric proc.psinfo.sname, this provides us with the runstate of all processes. Which processes were running shortly before the issue, at the issue, and afterwards?
[chris@rhel7u5a ~]# pminfo -f -a 20180815.09.28.0 -O @10:40:15 \
       proc.psinfo.sname | grep R
inst [7115 or "007115 /var/lib/pcp/pmdas/proc/pmdaproc"] value "R"
[chris@rhel7u5a ~]# pminfo -f -a 20180815.09.28.0 -O @10:41:19 \
       proc.psinfo.sname | grep R
inst [7115 or "007115 /var/lib/pcp/pmdas/proc/pmdaproc"] value "R"
inst [18345 or "018345 md5sum"] value "R"
[chris@rhel7u5a ~]# pminfo -f -a 20180815.09.28.0 -O @10:43:18 \
       proc.psinfo.sname | grep R
inst [7115 or "007115 /var/lib/pcp/pmdas/proc/pmdaproc"] value "R"
[chris@rhel7u5a ~]#
We see at all three times our PMDA running for the monitoring, and at the time of the issue additionally a process ‘md5sum’. Unfortunately we are not recording metric proc.schedstat.cpu_time in the default config, that one could have shown us that this md5sum process was the one burning most cpu time at 10:41. Pmlogger can be configured to archive this metric.
We can see more details about the process with the existing PCP data, also the owner of the process and ask the user for the background of their activities. Thanks for helping with this performance issue, PCP!
Final thoughts
We have seen how easy it is to get PCP up and running on Red Hat Enterprise Linux, how to access live and archived metric data. How about monitoring custom data from your applications, temperature sensor data from a system, or SMART data from hard disks? We will investigate monitoring of custom metrics in a future article, as well as creating graphs from the collected data.
-
Introduction to storage performance analysis with PCP provides an overview over PCP
-
Recommended manpages: PCPIntro(1), pminfo(1), pmrep(1), pmdiff(1)
This article is available in 3 localized versions: German, English and Japanese.
-
Klicken Sie hier, um diesen Artikel auf Deutsch zu lesen.
-
この記事の日本語版があります。
About the author

Christian Horn is a Senior Technical Account Manager at Red Hat. After working with customers and partners since 2011 at Red Hat Germany, he moved to Japan, focusing on mission critical environments. Virtualization, debugging, performance monitoring and tuning are among the returning topics of his
daily work. He also enjoys diving into new technical topics, and sharing the findings via documentation, presentations or articles.
Browse by channel

Automation
The latest on IT automation that spans tech, teams, and environments

Artificial intelligence
Explore the platforms and partners building a faster path for AI

Open hybrid cloud
Explore how we build a more flexible future with hybrid cloud

Security
Explore how we reduce risks across environments and technologies

Edge computing
Updates on the solutions that simplify infrastructure at the edge

Infrastructure
Stay up to date on the world’s leading enterprise Linux platform

Applications
The latest on our solutions to the toughest application challenges

Original shows
Entertaining stories from the makers and leaders in enterprise tech
Products
- Red Hat Enterprise Linux
- Red Hat OpenShift
- Red Hat Ansible Automation Platform
- Cloud services
- See all products
Tools
- Training and certification
- My account
- Developer resources
- Customer support
- Red Hat value calculator
- Red Hat Ecosystem Catalog
- Find a partner
Try, buy, & sell
Communicate
About Red Hat
We’re the world’s leading provider of enterprise open source solutions—including Linux, cloud, container, and Kubernetes. We deliver hardened solutions that make it easier for enterprises to work across platforms and environments, from the core datacenter to the network edge.
Select a language
Red Hat legal and privacy links
- About Red Hat
- Jobs
- Events
- Locations
- Contact Red Hat
- Red Hat Blog
- Diversity, equity, and inclusion
- Cool Stuff Store
- Red Hat Summit