Red Hat blog
In this post, I’d like to show you how to use Performance Co-Pilot (PCP) with Grafana and Redis to store and graph performance data for all the machines in your environment. We’ll do this in a simple two machine setup, but the concepts are the same as you add more machines.
Before starting with this post, make sure you've read through part one in the series!
In our two machine setup, we have server-1 and server-2. The box named server-1 will run Redis and collect PCP metrics for all hosts. This means that we need to budget space for the Redis database on this machine. For a default PCP setup, we will need roughly 100MB per host on disk and 200MB per host in memory. The mechanism that stores the data in the Redis database for us is called pmseries and to set it up, on server-1, we will edit /etc/pcp/pmproxy/pmproxy.conf and make sure that the following under [pmproxy] is set:
# support Redis protocol proxying
redis.enabled = true
And further in the [pmseries] section, make sure this is set:
# allow REST API queries of fast, scalable time series
enabled = true
yum install redis -y
systemctl start redis
systemctl enable redis
systemctl restart pmcd pmlogger pmproxy
And now server-1 should be logging historic performance data for all hosts that pmlogger is configured for. At present, pmlogger is only configured to gather data for server-1, so let’s go ahead and set it up to gather data for our other host, server-2.
On server-2, let’s change the default PMCD_LOCAL=1 to 0 to enable remote connections on the pmcd service. We find this value in /etc/sysconfig/pmcd:
# Behaviour regarding listening on external-facing interfaces;
# unset PMCD_LOCAL to allow connections from remote hosts.
# A value of 0 permits remote connections, 1 permits local only.
PMCD_LOCAL=0
We now need to allow service level connectivity:
firewall-cmd --add-service=pmcd --permanent
firewall-cmd --reload
Now we need to allow pcp to bind to unreserved ports:
setsebool -P pcp_bind_all_unreserved_ports on
And then finally, bounce the pcp services:
systemctl restart pmcd pmlogger
Now at this point, server-2 is configured in such a way that a pmlogger agent may connect to it and request logs.
Back on server-1, let’s tell the pmlogger agent about server-2 by editing /etc/pcp/pmlogger/control.d/remote and adding this line:
server-2 n n PCP_LOG_DIR/pmlogger/server-2 -r -T24h10m -c config.remote
Once this is done, we need to restart pmlogger:
systemctl restart pmlogger
After this, we should be able to do:
cd /var/log/pcp/pmlogger/server-2
ls *.0
And see files ending in `.0`:
20200923.16.41.0
This lets us know that we are now gathering pcp metric data from server-2 onto our server-1 box.
Let’s go back to the Grafana instance that we set up in the first post (http://server-1:3000) to take a look at how we can graph the metrics data from redis.
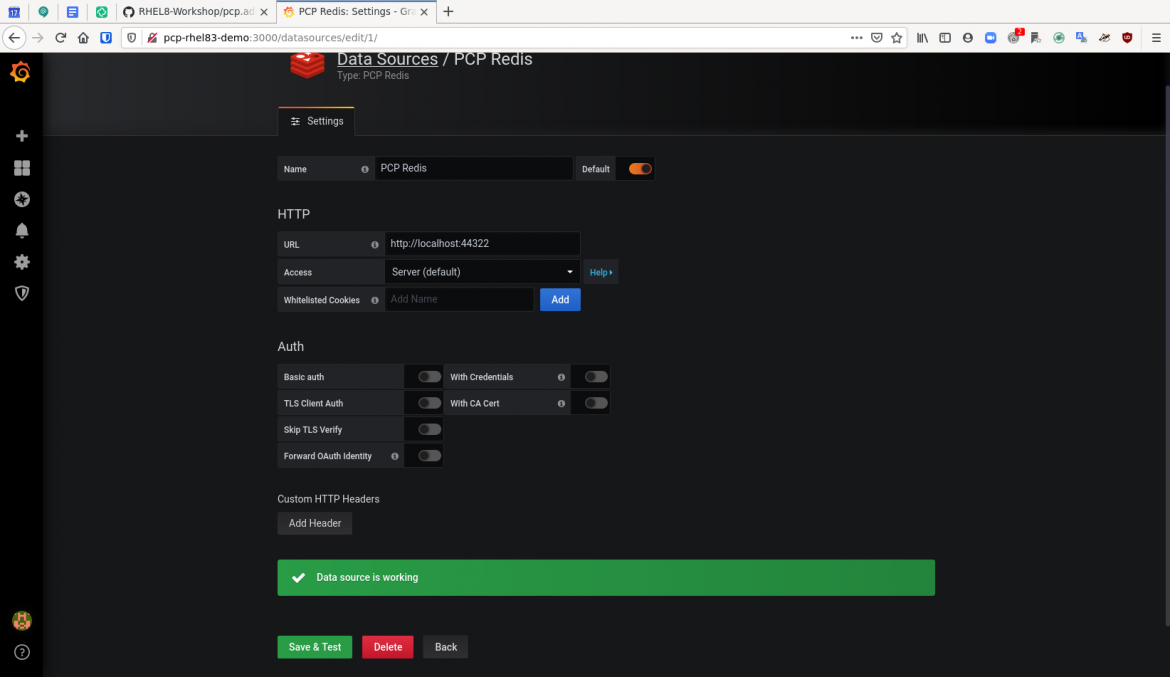
Click on the Configuration cog again and then “Data Sources”. At this point, you can click “Add Data Source”. Mouse over “PCP Redis” and click the “Select” button that appears. On this form in the HTTP section, add the url of “http://localhost:44322” and then at the bottom of the form, click “Save & Test”. You should get the message back “Data source is working”.

At this point, our configuration is finished and we can go see the results of our work. Click the “Dashboard” icon and then click “Manage”. At this point, you will see an option for “PCP Redis Host Overview”. Click that option.
By default, the “PCP Redis Host Overview” dashboard displays six hours worth of data, but you can change that to a shorter period of time if you would like. These charts have all sorts of metrics, such as:
-
load average
-
memory utilization
-
per-cpu busy (user/sys)
-
context switches per second
-
runnable processes
-
memory (used/cached/free)
-
network throughput in/out
-
network drops in/out
-
network packets in/out
-
tcp timeouts/listen errors/retransmits
-
disk latency/iops/throughput/utilization
 That’s a lot of good data to have on a host right out of the box! Also, in the upper left hand corner of the dashboard you will see a drop down menu for “Host”. This shows us the host that we are currently viewing the data for and also allows us to pick a different host to show the data for. As we have multiple hosts feeding their data into this host’s redis database, we are able to see these metrics for all of the hosts we have configured. Using the methods described in this blog allows us to have host level monitoring and access to historic performance data for our whole estate!
In the next and final post in this series, we’ll look at integrating Bpftrace into our setup!
About the author
Karl Abbott is a Senior Product Manager for Red Hat Enterprise Linux focused on the kernel and performance. Abbott has been at Red Hat for more than 15 years, previously working with customers in the financial services industry as a Technical Account Manager.

