
Blog de Red Hat
To most people, the Java Garbage Collector is a black box that happily goes about its business. Programmers develop an application, QE validates the functionality and the Operations team deploys it. Within that process, you may do some tweaking of the overall heap, PermGen / Metaspace or thread settings, but beyond that things just seem to work. The question then becomes, what happens when you start pushing the envelope? What happens when those defaults no longer suffice? As a developer, tester, performance engineer or architect, it’s an invaluable skill set to understand the basics of how Garbage Collection works, but also how to collect and analyze the corresponding data and translate it into effective tuning practices. In this ongoing series, we’re going to take you on a journey with the G1 Garbage Collector and transform your understanding from beginner to aficionado that places GC at the top of your performance pile.
 Read more about optimizing performance for the open-hybrid enterprise.
Read more about optimizing performance for the open-hybrid enterprise.
We’re leading off this series with the most fundamental of topics: What is the point of the G1 (Garbage First) Collector and how does it actually work? Without a general understanding of its goals, how it makes decisions and how it’s designed, you are setting out to achieve a desired end state with no vehicle or map to get you there.
At its heart, the goal of the G1 collector is to achieve a predictable soft-target pause time, defined through -XX:MaxGCPauseMillis, while also maintaining consistent application throughput. The catch and ultimate goal is to be able to maintain those targets with the present day demands of high-powered, multi-threaded applications with an appetite for continually larger heap sizes. A general rule with G1 is that the higher the pause time target, the achievable throughput, and overall latency become higher. The lower the pause time target, the achievable throughput and overall latency become lower. Your goal with Garbage Collection is to combine an understanding of the runtime requirements of your application, the physical characteristics of your application and your understanding of G1 to tune a set of options and achieve an optimal running state that satisfies your business requirements. It’s important to keep in mind that tuning is a constantly evolving process in which you establish a set of baselines and optimal settings through repetitive testing and evaluation. There is no definitive guide or a magic set of options, you are responsible for evaluating performance, making incremental changes and re-evaluating until you reach your goals.
For its part, G1 works to accomplish those goals in a few different ways. First, being true to its name, G1 collects regions with the least amount of live data (Garbage First!) and compacts/evacuates live data into new regions. Secondly, it uses a series of incremental, parallel and multi-phased cycles to achieve its soft pause time target. This allows G1 to do what’s necessary, in the time defined, irrespective of the overall heap size.
Above, we made reference to a new concept in G1 called ‘regions’. Simply put, a region represents a block of allocated space that can hold objects of any generation without the need to maintain contiguity with other regions of the same generation. In G1, the traditional Young and Tenured generations still exist. The young generation consists of Eden space, where all newly allocated objects start and Survivor space, where live eden objects are copied to during a collection. Objects remain in the Survivor space until they are either collected or old enough for promotion, defined by the XX:MaxTenuringThreshold (defaults to 15). The Tenured generation consists of the Old space, where objects are promoted from the Survivor space when they reach the XX:MaxTenuringThreshold. There is, of course, an exception to this and we’ll cover that towards the end of the article. The region size is calculated and defined when the JVM starts. It is based on the principle of having as close to 2048 regions as possible where each region is sized as a power of 2 between 1 and 64 MB. More simply put, for a 12 GB heap:
12288 MB / 2048 Regions = 6 MB - this is not a power of 2
12288 MB / 8 MB = 1536 regions - generally too low
12288 MB / 4 MB = 3072 regions - acceptable
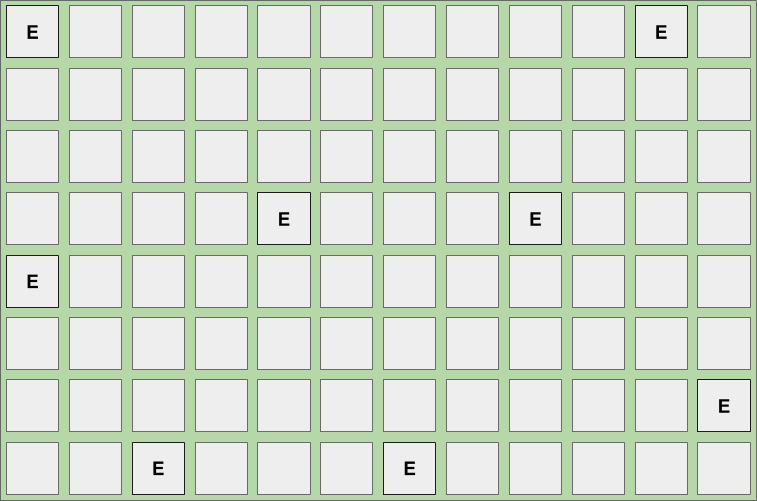
Based on the above calculation, the JVM would, by default, allocate 3072 regions, each capable of holding 4 MB, as illustrated in the diagram, below. You also have the option of explicitly specifying the region size through -XX:G1HeapRegionSize. When setting the region size, it’s important to understand the number of regions your heap-to-size ratio will create because the fewer the regions, the less flexibility G1 has and the longer it takes to scan, mark and collect each of them. In all cases, empty regions are added to an unordered linked list also known as the “free list”.
![]()
The key is that while G1 is a generational collector, the allocation and consumption of space is both non-contiguous and free to evolve as it gains a better understanding of the most efficient young to old ratio. When object production begins, a region is allocated from the free list as a thread-local allocation buffer (TLAB) using a compare and swap methodology to achieve synchronization. Objects can then be allocated within those thread-local buffers without the need for additional synchronization. When the region has been exhausted of space, a new region is selected, allocated and filled. This continues until the cumulative Eden region space has been filled, triggering an evacuation pause (also known as a young collection / young gc / young pause or mixed collection / mixed gc / mixed pause). The cumulative amount of Eden space represents the number of regions we believe can be collected within the defined soft pause time target. The percentage of total heap allocated for Eden regions can range from 5% to 60% and gets dynamically adjusted after each young collection based on the performance of the previous young collection.
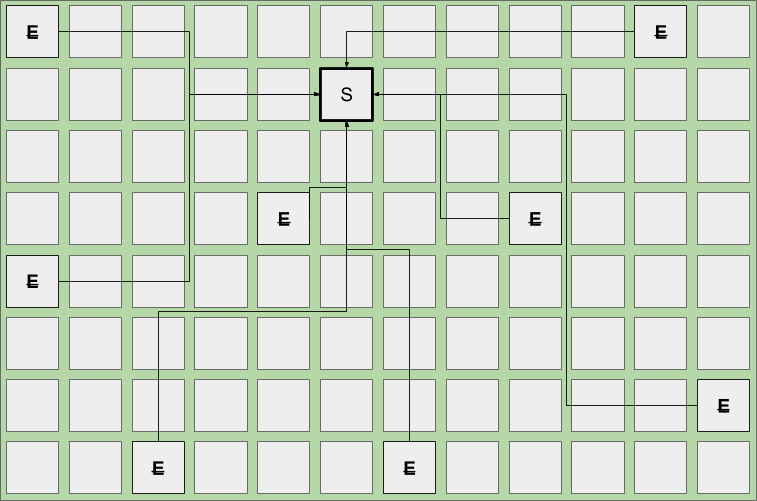
Here is an example of what it looks like with objects being allocated into non-contiguous Eden regions;
GC pause (young); #1
          [Eden: 612.0M(612.0M)->0.0B(532.0M) Survivors: 0.0B->80.0M Heap: 612.0M(12.0G)->611.7M(12.0G)]
GC pause (young); #2
          [Eden: 532.0M(532.0M)->0.0B(532.0M) Survivors: 80.0M->80.0M Heap: 1143.7M(12.0G)->1143.8M(12.0G)]
Based on the above ‘GC pause (young)’ logs, you can see that in pause #1, evacuation was triggered because Eden reached 612.0M out of a total of 612.0M (153 regions). The current Eden space was fully evacuated, 0.0B and, given the time taken, it also decided to reduce the total Eden allocation to 532.0M or 133 regions. In pause #2, you can see the evacuation is triggered when we reach the new limit of 532.0M. Because we achieved an optimal pause time, Eden was kept at 532.0M.
When the aforementioned young collection takes place, dead objects are collected and any remaining live objects are evacuated and compacted into the Survivor space. G1 has an explicit hard-margin, defined by the G1ReservePercent (default 10%), that results in a percentage of the heap always being available for the Survivor space during evacuation. Without this available space, the heap could fill to a point in which there are no available regions for evacuation. There is no guarantee this will not still happen, but that’s what tuning is for! This principle ensures that after every successful evacuation, all previously allocated Eden regions are returned to the free list and any evacuated live objects end up in Survivor space.
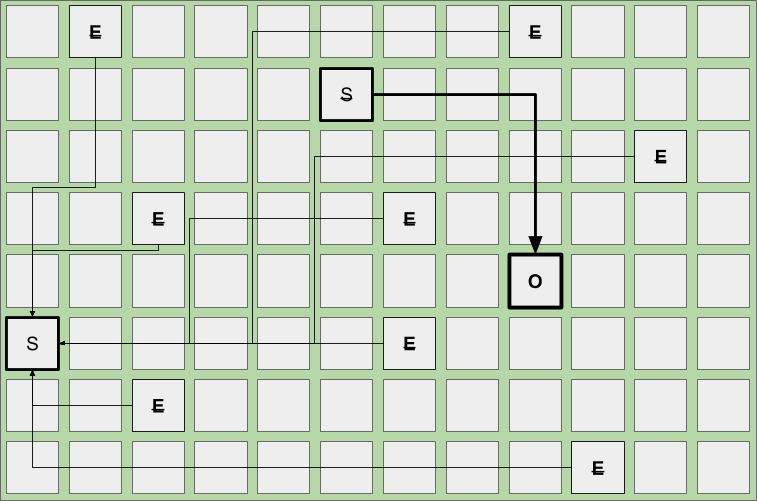
Below is an example of what a standard young collection would look like:
Continuing with this pattern, objects are again allocated into newly requested Eden regions. When Eden space fills up, another young collection occurs and, depending on the age (how many young collections the various objects have survived) of existing live objects, you will see promotion to Old regions. Given the Survivor space is part of the young generation, dead objects are collected or promoted during these young pauses.
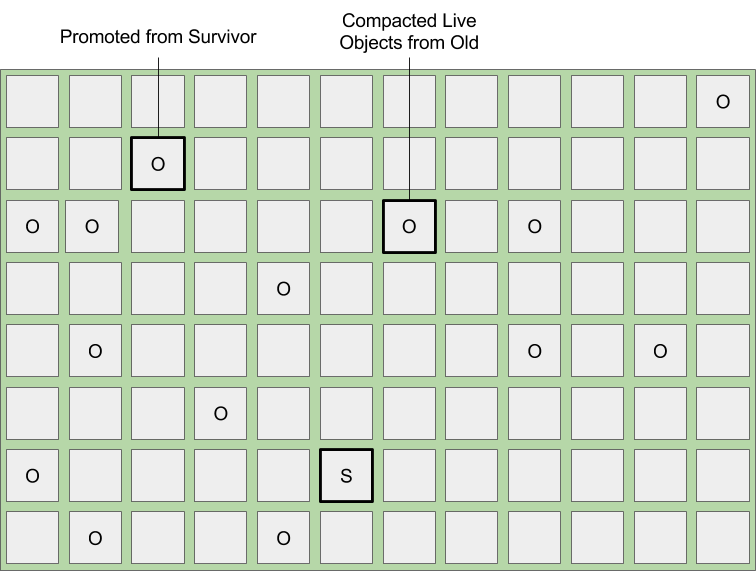
Below is an example of what a young collection looks like when live objects from the Survivor space are evacuated and promoted to a new region in the Old space while live objects from Eden are evacuated into a new Survivor space region. Evacuated regions, denoted by the strikethrough, are now empty and returned to the free list.
G1 will continue with this pattern until one of three things happens:
-
It reaches a configurable soft-margin known as the InitiatingHeapOccupancyPercent (IHOP).
-
It reaches its configurable hard-margin (G1ReservePercent)
-
It encounters a humongous allocation (this is the exception I referred to earlier, more on this at the end).
Focusing on the primary trigger, the IHOP represents a point in time, as calculated during a young collection, where the number of objects in the old regions account for greater than 45% (default) of the total heap. This liveness ratio is constantly being calculated and evaluated as a component of each young collection. When one of these triggers are hit, a request is made to start a concurrent marking cycle.
8801.974: [G1Ergonomics (Concurrent Cycles) request concurrent cycle initiation, reason: occupancy higher than threshold, occupancy: 12582912000 bytes, allocation request: 0 bytes, threshold: 12562779330 bytes (45.00 %), source: end of GC]
8804.670: [G1Ergonomics (Concurrent Cycles) initiate concurrent cycle, reason: concurrent cycle initiation requested]
8805.612: [GC concurrent-mark-start]
8820.483: [GC concurrent-mark-end, 14.8711620 secs]
In G1, concurrent marking is based on the principle of snapshot-at-the-beginning (SATB). This means, for efficiency purposes, it can only identify objects as being garbage if they existed when the initial snapshot was taken. Any newly allocated objects that appear during the concurrent marking cycle are considered to be live irrespective of their true state. This is important because the longer it takes for concurrent marking to complete, the higher the ratio will be of what is collectible versus what is considered to be implicitly live. If you allocate more objects during concurrent marking than you end up collecting, you will eventually exhaust your heap. During the concurrent marking cycle, you will see young collections continue as it is not a stop-the-world event.
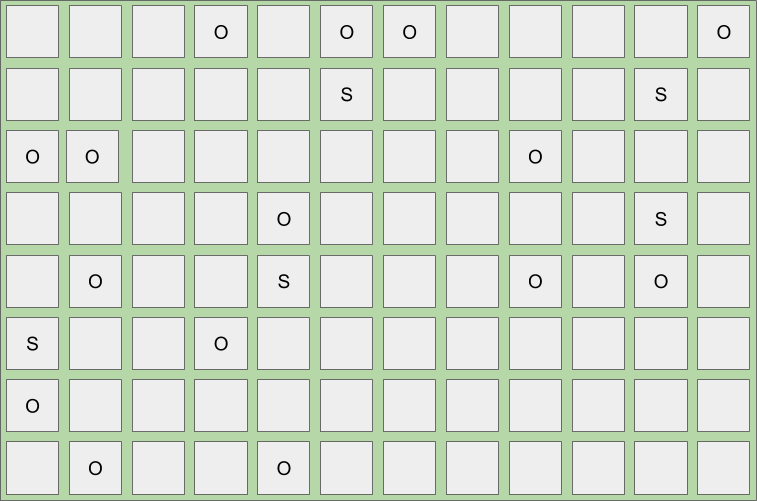
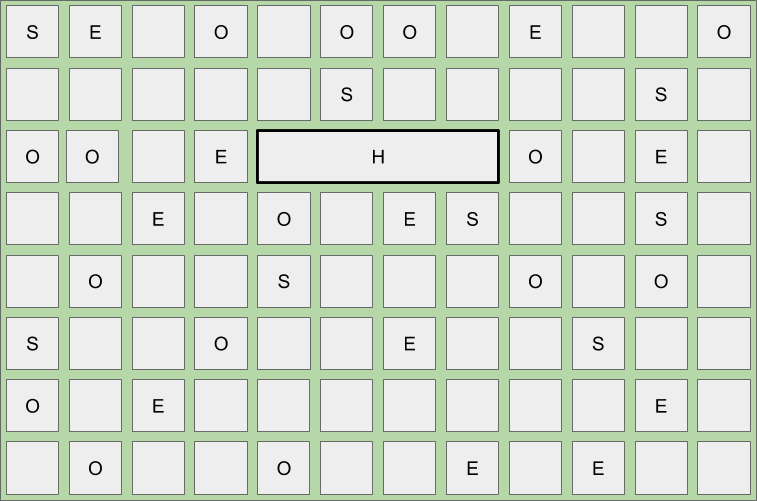
Below is an example of what a heap may look like after a young collection when the IHOP threshold is reached, triggering a concurrent mark.
Once the concurrent marking cycle completes, a young collection is immediately triggered, followed by a second type of evacuation, known as a mixed collection. A mixed collection works almost exactly like a young collection, with two major differences. First, a mixed collection is also going to collect, evacuate and compact a select set of old regions. Second, mixed collections are not based on the same evacuation triggers a young collection uses. They operate with the goal of collecting as quickly and as frequently as possible. They do this to minimize the number of allocated Eden / Survivor regions in order to maximize the number of Old regions selected within the soft pause target.
8821.975: [G1Ergonomics (Mixed GCs) start mixed GCs, reason: candidate old regions available, candidate old regions: 553 regions, reclaimable: 6072062616 bytes (21.75 %), threshold: 5.00 %]
The above log tells us that a mixed collection is starting because the number of candidate Old regions (553) have a combined 21.75% reclaimable space. This value is higher than our 5% minimum threshold (5% default in JDK8u40+ / 10% default in JDK7) defined by the G1HeapWastePercent and as such, mixed collections will begin. Because we don’t want to perform wasted work, G1 stays true to the garbage first policy. Based on an ordered list, candidate regions are selected based on their live object percentage. If an Old region has fewer live objects than the percentage defined by G1MixedGCLiveThresholdPercent (defaults to 85% in JDK8u40+ and 65% in JDK7), we add it to the list. Simply put, if an Old region is greater than 65% (JDK7) or 85% (JDK8u40+) live, we don’t want to waste our time trying to collect and evacuate it during this mixed cycle.
8822.178: [GC pause (mixed) 8822.178: [G1Ergonomics (CSet Construction) start choosing CSet, _pending_cards: 74448, predicted base time: 170.03 ms, remaining time: 829.97 ms, target pause time: 1000.00 ms]
Compared to a young collection, a mixed collection will look to collect all three generations within the same pause time target. It manages this through the incremental collection of the Old regions based on the value of G1MixedGCCountTarget (defaults to 8). Meaning, it will divide the number of candidate Old regions by the G1MixedGCCountTarget and try to collect at least that many regions during each cycle. After each cycle finishes, the liveness of the Old region is re-evaluated. If the reclaimable space is still greater than the G1HeapWastePercent, mixed collections will continue.
8822.704: [G1Ergonomics (Mixed GCs) continue mixed GCs, reason: candidate old regions available, candidate old regions: 444 regions, reclaimable: 4482864320 bytes (16.06 %), threshold: 10.00 %]
This diagram represents a mixed collection. All Eden regions are collected and evacuated to Survivor regions and, depending on age, all survivor regions are collected and sufficiently tenured live objects are promoted to new Old regions. At the same time, a select subset of Old regions are also collected and any remaining live objects are compacted into new Old regions. The process of compaction and evacuation allows for a significant reduction in fragmentation and ensures adequate free regions are maintained.

This diagram represents the heap after a mixed collection finishes. All Eden regions are collected and live objects reside in a newly allocated Survivor region. Existing Survivor regions are collected and live objects are promoted to new Old regions. The set of collected Old regions are returned to the free list and any remaining live objects are compacted into new Old regions.
Mixed collections will continue until all eight are completed or until the reclaimable percentage no longer meets the G1HeapWastePercent. From there, you will see the mixed collection cycle finish and the following events will return to standard young collections.
8830.249: [G1Ergonomics (Mixed GCs) do not continue mixed GCs, reason: reclaimable percentage not over threshold, candidate old regions: 58 regions, reclaimable: 2789505896 bytes (9.98 %), threshold: 10.00 %]
Now that we have covered the standard use-cases, let’s jump back and discuss the exception I mentioned earlier. It applies in situations where the size of an object is greater than 50% of a single region. In this case, objects are considered to be humongous and are handled by performing specialized humongous allocations.
Region Size: 4096 KB
Object A: 12800 KB
Result: Humongous Allocation across 4 regions
This diagram outlines the humongous allocation of a 12.5 MB object spanning 4 contiguous regions.
-
Humongous allocation represents a single object, and as such, must be allocated into contiguous space. This can lead to significant fragmentation.
-
Humongous objects are allocated to a special humongous region directly within the Old generation. This is because the cost to evacuate and copy such an object across the young generations can be too high.
-
Even though the object in question is only 12.5 MB, it must consume four full regions accounting for 16 MB of total usage.
-
Humongous allocations always trigger a concurrent marking cycle, whether the IHOP criteria is met or not.
A few humongous objects may not cause a problem, but a steady allocation of them can lead to significant heap fragmentation and a noticeable performance impact. Prior to JDK8u40, humungous objects could only be collected through a Full GC so the potential for this to impact JDK7 and early JDK8 users is very high. This is why it’s critical to understand both the size of objects your application produces and what G1 is defining for region size. Even in the latest JDK8, if you are doing significant numbers of humongous allocations, it is a good idea to evaluate and tune away as many as possible.
4948.653: [G1Ergonomics (Concurrent Cycles) request concurrent cycle initiation, reason: requested by GC cause, GC cause: G1 Humongous Allocation]
7677.280: [G1Ergonomics (Concurrent Cycles) do not request concurrent cycle initiation, reason: still doing mixed collections, occupancy: 14050918400 bytes, allocation request: 16777232 bytes, threshold: 12562779330 32234.274: [G1Ergonomics (Concurrent Cycles) request concurrent cycle initiation, reason: occupancy higher than threshold, occupancy: 12566134784 bytes, allocation request: 9968136 bytes, threshold: 12562779330 bytes (45.00 %), source: concurrent humongous allocation]
Finally and unfortunately, G1 also has to deal with the dreaded Full GC. While G1 is ultimately trying to avoid Full GC’s, they are still a harsh reality especially in improperly tuned environments. Given that G1 is targeting larger heap sizes, the impact of a Full GC can be catastrophic to in-flight processing and SLAs. One of the primary reasons is that Full GCs are still a single-threaded operation in G1. Looking at causes, the first, and most avoidable, is related to Metaspace.
[Full GC (Metadata GC Threshold) 2065630K->2053217K(31574016K), 3.5927870 secs]
An upfront tidbit is to update to JDK8u40+ where class unloading no longer requires a Full GC! You may still run into a Full GC on Metaspace, but that’s going to be related to UseCompressedOops and UseCompressedClassesPointers or the time it takes for concurrent marking (something we’ll discuss in a future post).
The second two causes are real and often times unavoidable. Our job as engineers is to do our best to delay and avoid these situations through tuning and evaluating the code producing the objects we’re trying to collect. This first major issue is a ‘to-space exhausted’ event followed by a Full GC. This event accounts for evacuation failures in which the heap can no longer be expanded and there are no available regions to accommodate evacuation. If you recall, we previously discussed the hard-margin, defined by the G1ReservePercent. This event says that you’re evacuating more objects to the to-space than your reserve accounts for and that the heap is so full, we have no other available regions. On some occasions, if the JVM can resolve the space condition, this will not be followed by a Full GC, but it is still a very costly stop the world event.
6229.578: [GC pause (young) (to-space exhausted), 0.0406140 secs]
6229.691: [Full GC 10G->5813M(12G), 15.7221680 secs]
If you see this pattern happening often, you can immediately assume you a have a lot of room for tuning! The second case is a Full GC during concurrent marking. In this case, we’re not failing evacuation, we’re simply running out of heap before concurrent marking can finish and trigger a mixed collection. The two causes are either a memory leak or you’re producing and promoting objects faster than they can be collected. If the Full GC collection is a significant portion of the heap, you can assume it’s related to production and promotion. If very little is being collected and you eventually hit an OutOfMemoryError, you’re more than likely looking at a memory leak.
57929.136: [GC concurrent-mark-start]
57955.723: [Full GC 10G->5109M(12G), 15.1175910 secs]
57977.841: [GC concurrent-mark-abort]
In closing, I hope this post sheds some light on the way G1 is designed and how it goes about making its garbage collection decisions. I hope you stay tuned for the next article in this series where we will dig into the various options to collect and interpret the monumental amount of data produce via advanced GC logging.

Matt Robson is a senior Middleware Technical Account Manager and Garbage Collection subject matter expert based in Toronto. He has spent the last 10+ years designing, implementing, testing and tuning large scale middleware and cloud infrastructure for large corporations.
Twitter: https://twitter.com/mattjrobson #RHTAM
Find more posts by Matt at https://www.redhat.com/en/about/blog/authors/matt-robson
A Red Hat Technical Account Manager (TAM) is a specialized product expert who works collaboratively with IT organizations to strategically plan for successful deployments and help realize optimal performance and growth. The TAM is part of Red Hat’s world class Customer Experience and Engagement organization and provides proactive advice and guidance to help you identify and address potential problems before they occur. Should a problem arise, your TAM will own the issue and engage the best resources to resolve it as quickly as possible with minimal disruption to your business.