Blog Red Hat
One of the exciting features in the Red Hat Satellite 6.5 release is the new reporting engine. The Satellite Server is frequently a focal point of an organization's Red Hat environment, and the reporting engine allows Satellite users to create reports that can be exported. These reports can include details on the Satellite client hosts, subscriptions, applicable errata, etc. The reporting engine uses the embedded Ruby (ERB) language.
Satellite 6.5 includes several pre-canned reports provided by Red Hat, while also providing a reporting engine that Satellite users can use to customize the included reports, or to create their own custom reports.
The included reports in Satellite 6.5 use the comma separated value (CSV) format, however, in this post we will also explore creating a custom report that uses HTML formatting.
Overview of the reports included with Satellite 6.5
Satellite 6.5 includes four reports:
-
Applicable errata report shows a list of errata that is applicable to content hosts (can optionally filter on hosts or errata).
-
Host statuses report shows the status of your Satellite hosts (can optionally filter on hosts).
-
Registered hosts report shows information on your Satellite hosts such as IP address, OS version, and attached subscriptions (can optionally filter on hosts).
-
Subscriptions report shows information on subscriptions, such as the quantity, the number available, and the SKU (can optionally filter on subscription parameters).
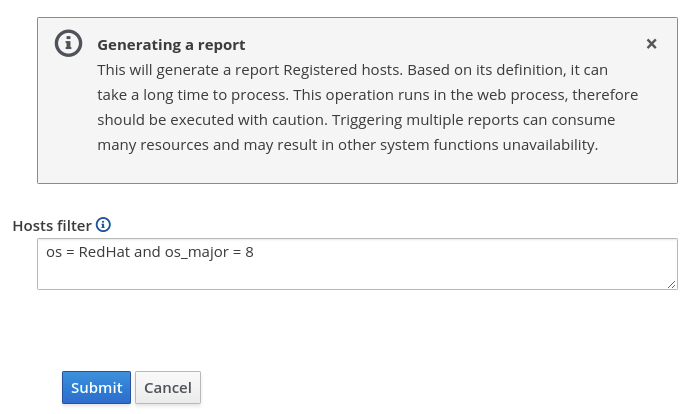
To generate a report, go to the Monitor menu, and select Report Templates. At this point, click the Generate button to the right of the report you would like to generate. The report will prompt for user input to optionally filter down the results of the report. Leave the filter blank to see all results, or you can type in a filter to limit the report results. For example, if I only wanted to see RHEL 8 hosts in the Registered Hosts report, we could use a host filter of os = RedHat and os_major = 8 to limit the report to RHEL 8 hosts, as shown in this screenshot:

Once you generate and download a report, you can open it a spreadsheet application such as LibreOffice Calc, which can import the CSV report and format it in columns, such as in this screenshot that shows an example Applicable errata report output:

Note that the included reports have Default checked if you view their details. This means they are automatically added to new Satellite organizations and locations.
Customizing an Included Report
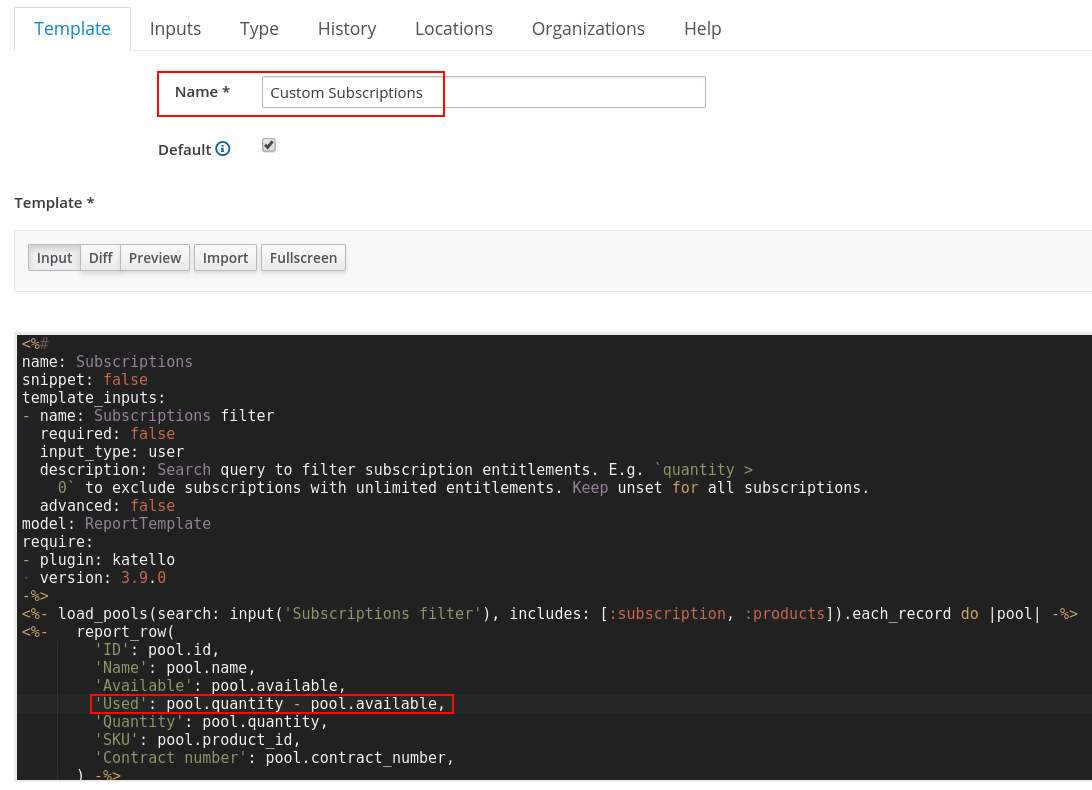
In this section, we will cover how to make a modification to the included Subscriptions report. This report shows the total number of subscriptions, as well as the number of available subscriptions. We will add an additional column that shows the used subscriptions, which is the number of subscriptions minus the number of available subscriptions. For example, if we have 50 RHEL subscriptions and 10 subscriptions available, then we are using 40 subscriptions.
The included reports are locked, and it is recommended you do not edit any of the included reports. You can instead clone the report, give it a new name, and modify the cloned copy.
In this example, we will be modifying the Subscriptions report, so we will first clone it by going to the Monitor menu and selecting Report Templates. Next, we will press the drop down menu to the right of the Subscriptions report template, and select Clone. We’ll then set the name to Custom Subscriptions and add a new line to the report between the Available and Quantity lines of the report that will add a column to the report to show used subscriptions: 'Used': pool.quantity - pool.available, Note the comma at the end of the line. Once done, your new report should look similar to this screenshot:

Next, we’ll click the Submit button, which should take you back to the Report Templates page. Then click the Generate button to the right of the new Custom Subscriptions report that was just created. Leave the Subscriptions filter blank, and click the Submit button. The report should be generated and downloaded, and should now contain the Used column that was added to the report.

To get help on the syntax of the embedded Ruby language, click on the Help tab while editing a report. This will show an overview of the syntax, variables, and methods that can be used.
Creating a Custom Report
Next, we will look at an example of creating a custom report which shows the Ansible Roles that are assigned to hosts within Satellite. We’ll start by going to Monitor menu and clicking on Report Templates. Next, click on the Create Template button. In this example, we’ll name the report Ansible Roles Report, and paste in the following ERB code:
<%#
name: Ansible Roles Report
snippet: false
template_inputs:
- name: hosts
 required: false
 input_type: user
 description: Limit the report only on hosts found by this search query. Keep empty
   for report on all available hosts.
 advanced: false
model: ReportTemplate
-%>
<% load_hosts(search: input('hosts'), includes: :ansible_roles).each_record do |host| -%>
<%   report_row({
       'Name': host.name,
       'All Ansible Roles': host.all_ansible_roles
     }) -%>
<% end -%>
<%= report_render -%>
This code will generate a report of hosts and show their “all_ansible_roles” attribute.
Next, go to the Inputs tab, and click the + Add Input button. Set the name to hosts, and for a description type Filter by hosts (optional). Then we’ll click the Submit button, and click the Generate button to the right of the report that was just created. You can filter by hosts, or just click Submit to see a report of all the hosts. Here is an example of what the report looks like when viewed in LibreOffice Calc:

Creating an HTML Report
The Satellite reporting engine is very flexible, and is capable of generating reports in formats other than CSV. For example, we can create a new report, based on the included Host Statuses report, but format it as an HTML table, including custom background colors based on the status. In this example, I created a clone of the Host Statuses report, and then updated the ERB code for the report to this example code which generates an HTML based report:
<!DOCTYPE html>
<html>
<head>
   <title>Host Statuses</title>
   <style>
       th {
           background-color: black;
           color: white;
       }
       td.green {
           background-color:#92d400;
           color:black;
       }
       td.yellow {
           background-color:#f0ab00;
           color:black;
       }
       td.red {
           background-color:#CC0000;
           color:black;
       }
       table,th,td {
               border-collapse:collapse;
               border: 1px solid black;
       }
   </style>
</head>
<body>
<table>
<tr>
       <th> Hostname </th>
       <th> Status </th>
<% load_hosts(search: input('hosts'), includes: :host_statuses).each_record do |host| -%>
   <% all_host_statuses_hash(host).each do |key, value|  -%>
       <th> <%= key %> </th>
   <% end -%>
   <% break -%>
<% end -%>
</tr>

<%- load_hosts(search: input('hosts'), includes: :host_statuses).each_record do |host| -%>
   <tr>
   <td> <%= host.name   %> </td>
   <% if host.global_status == 0 -%>
       <td class="green"> OK </td>
   <% elsif host.global_status == 1 -%>
       <td class="yellow"> Warning </td>
   <% else -%>
       <td class="red"> Error (<%= host.global_status %>) </td>
   <% end -%>

   <% all_host_statuses_hash(host).each do |key, value|  -%>
       <% if value == 0 -%>
           <td class="green"> OK </td>
       <% elsif value == 1  -%>
           <td class="yellow"> Warning </td>
       <% else -%>
           <td class="red"> Error (<%= value %>) </td>
       <% end -%>
   <% end -%>
   </tr>
<% end -%>

</table>
</body>
</html>
The report generates HTML output that looks similar to this when displayed in a web browser:

Running Reports from the Command Line
Reports can be generated from the command line with the hammer command, and can be automated using cron.
To run a report from the command line, use the hammer report-template generate --name “<report name>” command, such as:
# hammer report-template generate --name "Host statuses HTML”
The contents of the report are run and shown on the console. The output can be redirected to a file and it would be possible to setup cron to run a shell script to generate the report, then email it out. Many mail clients can render HTML output, which opens the possibility of automating HTML reports that are emailed out on a schedule and rendered in the email client.
Summary and Closing
The reporting engine in Satellite 6.5 is a powerful tool that can help export the valuable data that organizations have in Satellite. It is flexible and allows Satellite customers to use the included reports, modify the included reports, or create their own new custom reports. For more on the Satellite Reporting Engine, see the video overview on YouTube.
À propos de l'auteur
Brian Smith is a Product Manager at Red Hat focused on RHEL automation and management. He has been at Red Hat since 2018, previously working with Public Sector customers as a Technical Account Manager (TAM).

