Red Hat ブログ
We have tested a variety of configurations, object sizes, and client worker counts in order to maximize the throughput of a seven node Ceph cluster for small and large object workloads. As detailed in the first post the Ceph cluster was built using a single OSD (Object Storage Device) configured per HDD, having a total of 112 OSDs per Ceph cluster. In this post, we will understand the top-line performance for different object sizes and workloads.
Note: The terms “read” and HTTP GET is used interchangeably throughout this post, as are the terms HTTP PUT and “write.”
Large-Object workload
Large-object sequential input/output (I/O) workloads are one of the most common use cases for Ceph object storage. These high-throughput workloads include big data analytics, backup, and archival systems, image storage, and streaming audio, and video. For these types of workloads throughput (MB/s or GB/s) is the key metric that defines storage performance.
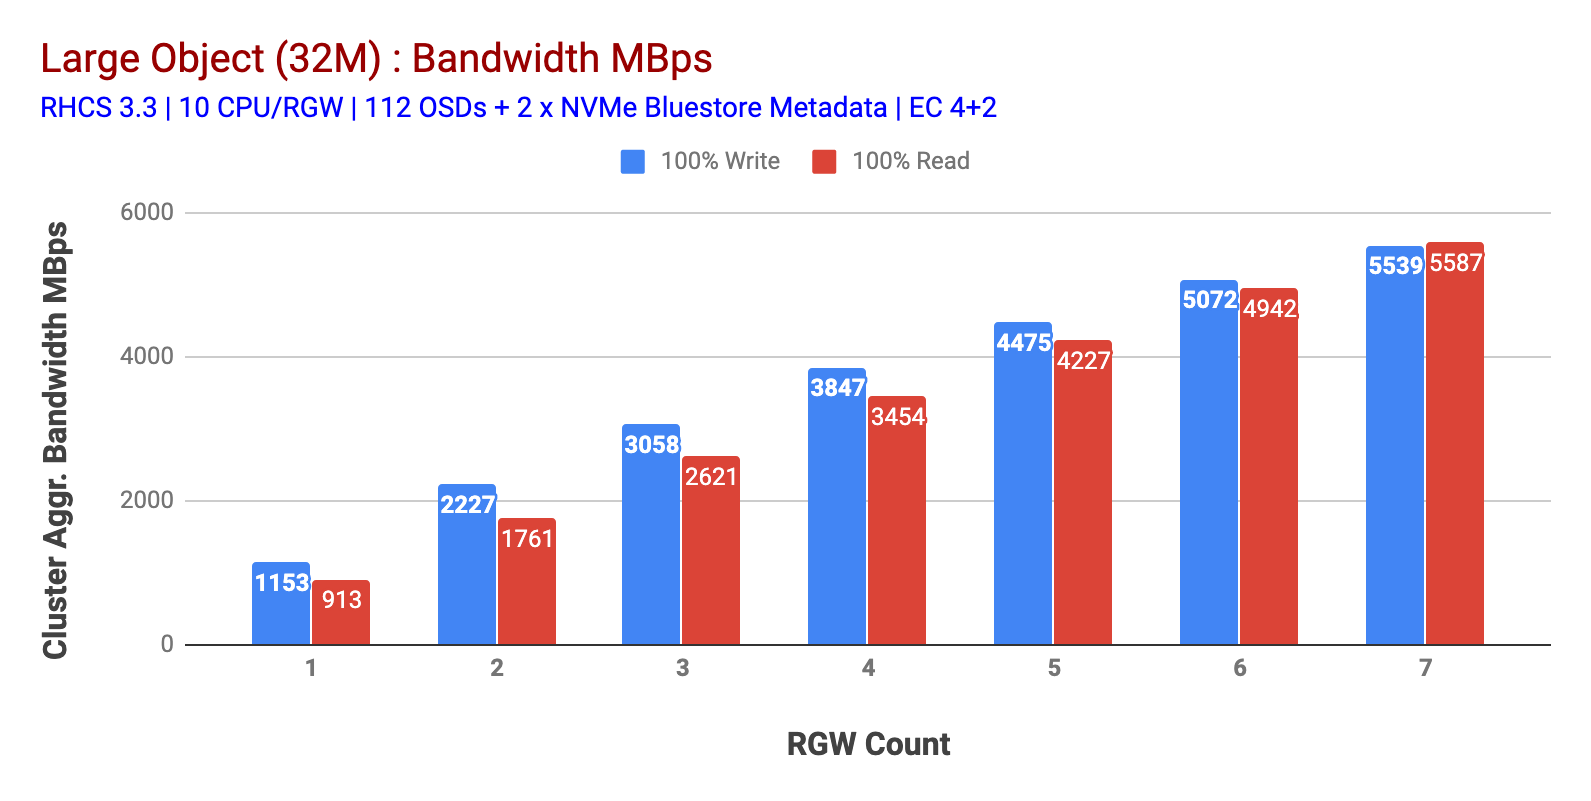
As shown in Chart 1 Large-object 100% HTTP GET and HTTP PUT workload exhibited sub-linear scalability when incrementing the number of RGW hosts. As such we measured ~5.5 GBps aggregated bandwidth for HTTP GET and HTTP PUT workloads and interestingly we did not notice resource saturation in Ceph cluster nodes.
This cluster can churn out more if we can direct more load to it. So we identified two ways to do that. 1) Add more client nodes 2) Add more RGW nodes. We could not go with option 1 as we were limited by the physical client nodes available in this lab. So we opted for option 2 and ran another round of tests but this time with 14 RGWs.
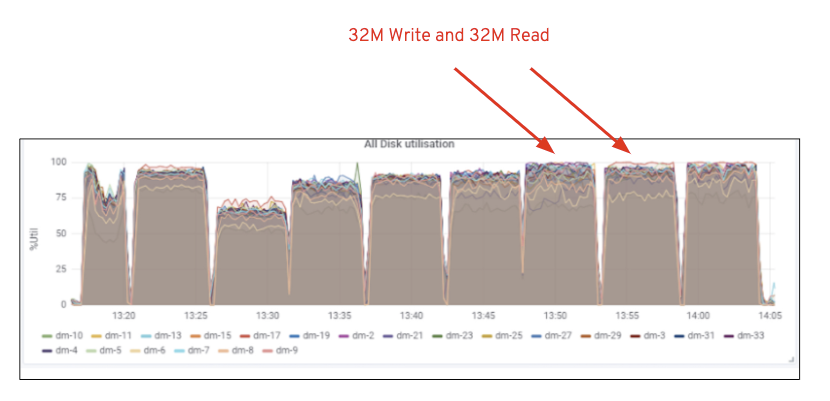
As shown in Chart 2, compared to the 7 RGW test, 14 RGW test yielded a 14% higher write performance, topping at ~6.3GBps, similarly, the HTTP GET workload showed 16% higher read performance, topping ~6.5GBps. This was the maximum aggregated throughput observed on this cluster after which media (HDD) saturation was noticed as depicted in Figure 1. Based on the results, we believe that have we added more Ceph OSD nodes to this cluster, the performance could have been scaled even further, until limited by resource saturation.

Chart 1: Large Object test

Chart 2: Large Object test with 14 RGWs

Figure 1: Ceph OSD (HDD) media utilization
Small Object workload
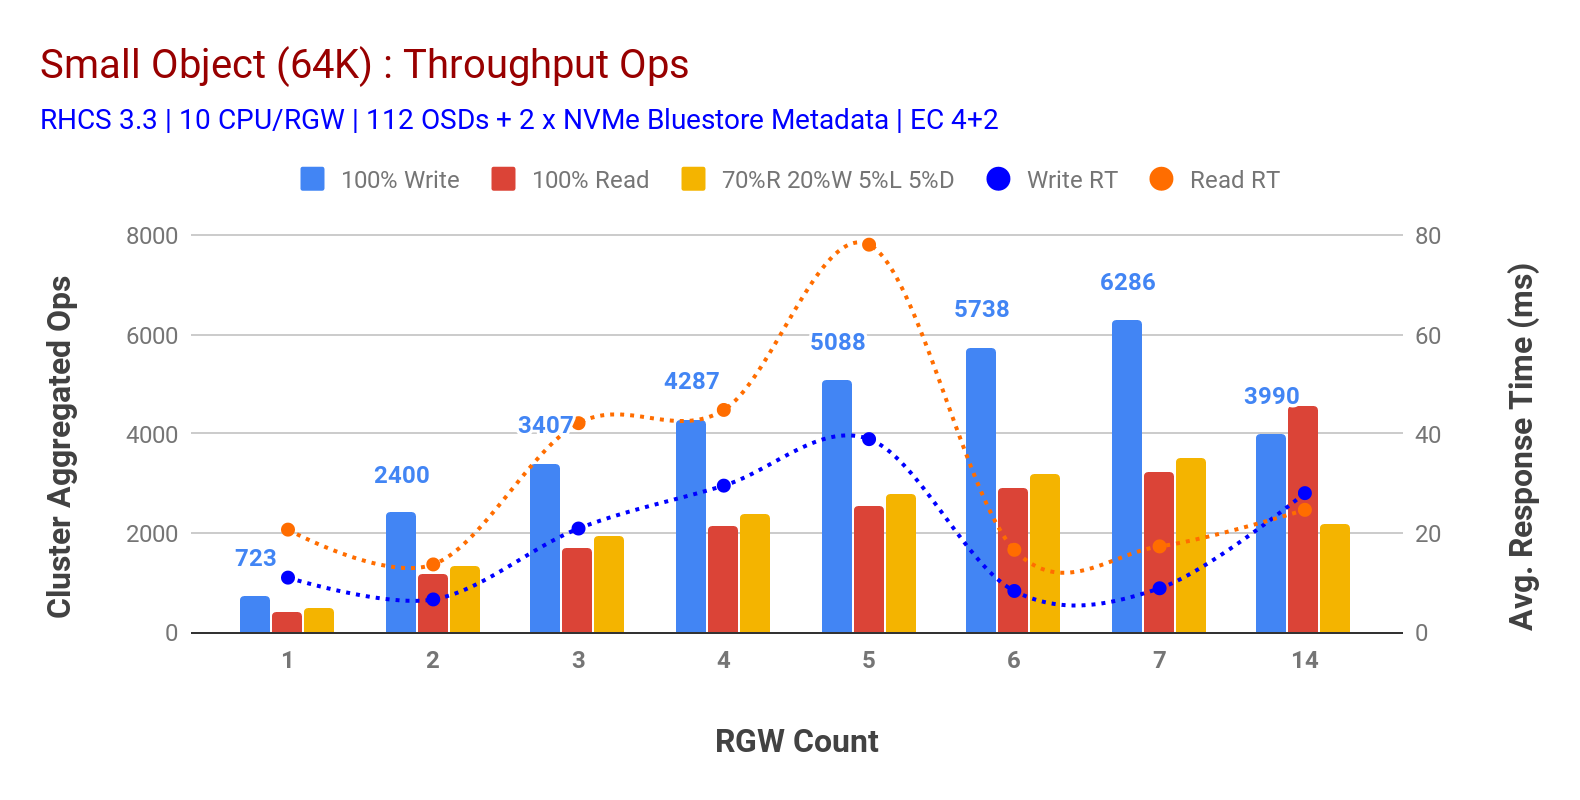
As shown in Chart 3 small object 100% HTTP GET and HTTP PUT workloads exhibited sub-linear scalability when incrementing the number of RGW hosts. As such we measured ~6.2K Ops throughput for HTTP PUT at 9ms application write latency and ~3.2K Ops for HTTP GET workloads with 7 RGW instances.
Until 7 RGW instances, we did not notice resource saturation, so we doubled down on RGW instances by scaling those to 14 and observed degraded performance for HTTP PUT workload which is attributed to media saturation, while HTTP GET performance scaled up and topped out at ~4.5K Ops. As such, write performance could have scaled higher, had we added more Ceph OSD nodes. As far as read performance is concerned, we believe that adding more client nodes should have improved it, but we did not have any more physical nodes in the lab to test this hypothesis.
Another interesting observation from Chart 3 is the reduced average response time for HTTP PUT workloads which gauged at 9ms while HTTP GET showed 17ms of average latency measured from the application generating workload. We believe that one of the reasons for single-digit application latency for write workload is the combination of performance improvement coming from the BlueStore OSD backend as well as the high performance Intel Optane NVMe used to back BlueStore metadata device. It's worth noting that achieving single digit write average latency from an Object Storage system is non-trivial. As depicted in Chart 3, Ceph object storage when deployed with BlueStore OSD backend and Intel Optane for metadata can achieve the write throughput at lower response time.

Chart 3: Small Object Test
Summary and up next
The fixed-size cluster used in this testing has delivered ~6.3GBps and ~6.5GBps large object bandwidth for write and read workloads respectively. The same cluster for small object size has delivered ~6.5K Ops and ~4.5K Ops for write and read workload, respectively.
The results have also shown that BlueStore OSD in combination with Intel Optane NVMe has delivered single-digit average application latency, which is non-trivial for object storage systems. In the next post, we will explore the performance associated with bucket dynamic sharding and how the pre-sharding bucket can help in deterministic performance.
