In this post:
-
How to use Red Hat Virtualization dashboards.
-
Explanation of default dashboards.
-
How to create custom dashboards from the built-in options that come with Red Hat Virtualization.
In this post we'll explore how to monitor a Red Hat Virtualization environment so you can visualize performance, resources and trends.
As an administrator, it can be difficult to get the right level of visibility across your infrastructure. With the Red Hat Virtualization monitoring portal and Grafana dashboards, you can see resources that are about to run out and catch problems early, see underutilized resources to ensure they are used efficiently, and view trends over time to see the big picture. Your infrastructure activity can be seen from a minute back to five years of history.

The “Storage Domains Inventory” Pre-Built Dashboard.
Grafana integration is usually configured by default, from Red Hat Virtualization 4.4.8 and above. If it's not, you can follow these steps to configure Grafana manually:
1. Put the environment in global maintenance mode:
# hosted-engine --set-maintenance --mode=global
2. Log in to the machine where you want to install Grafana.
3. Run the engine-setup command as follows:
# engine-setup --reconfigure-optional-components
4. Answer Yes to install Grafana on this machine:
Configure Grafana on this host (Yes, No) [Yes]:
5. Disable global maintenance mode:
# hosted-engine --set-maintenance --mode=none
6. To access the Grafana dashboards:
Go to https://<engine FQDN or IP address>/ovirt-engine-grafana, or Click Monitoring Portal in the web administration welcome page for the Administration Portal.
For additional information, see Configuring Grafana on the Red Hat Customer Portal. From version 4.4.8, only if upgrading from 4.3 to 4.4.8 and above Grafana will not be configured by default if the data warehouse is on a remote machine or if you are restoring from backup.
The Red Hat Virtualization monitoring portal includes a number of built-in Grafana dashboards for visualizing the datacenter, cluster, host, and virtual machine data:
-
Executive dashboards: display the user console connection activity, operating system count for hosts, and active virtual machines.
-
Trend dashboards: display trends in virtual machines, CPU, memory, network, interface, transmit and receive, disks, read and write activity.
-
Service Level dashboards: display uptime, downtime, quality of service, and intervals for important thresholds (CPU, memory).
-
Inventory dashboards: displays an inventory list of hosts in a cluster, disk usage in a storage domain, virtual machines in a cluster, and resources overcommit rates per data center.
Let's look at a few examples!
The “Inventory Dashboard” shows for each data center the usage and overcommit rates for CPU, memory and disk size.
In addition, the user can press on the data center name and it will lead to the “Data Center Dashboard”, which shows detailed information about the data center.
With this information it will be easier to identify and balance the resources between data centers.

The “Virtual Machines Uptime Dashboard” shows for each virtual machine the planned and unplanned downtime over the selected period.
In addition, the user can click on the virtual machine name and it will lead to the “Virtual Machine Dashboard,” which shows detailed information about the virtual machine.
With this information it will be easier to identify unused virtual machines, the size of their resources, their users and more.
Full dashboards descriptions can be found in the Administration Guide: Built-in Grafana dashboards.
We allow the user to add data from the data warehouse or customize the pre-build dashboards as they wish, by creating custom dashboards:
-
No changes can be saved to the pre-built dashboards.
-
To add a custom dashboard duplicate the desired dashboard or create a new one.
-
The custom dashboards will be saved after upgrade.
-
For example, the user can add the disk/s size of the virtual machines to the “Virtual Machine Uptime (BR46)” panel (the second example we mentioned above), and have a better understanding which virtual machine needs to be checked first.
For information on the data available in the data warehouse see "Statistics History Views, Configuration History Views."
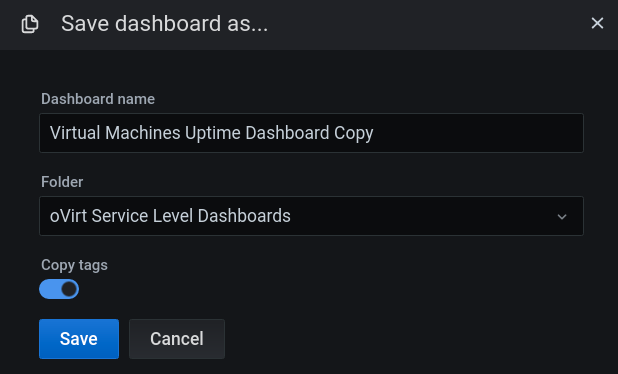
Want to duplicate an existing dashboard? Here's how to do it.
1. Enter the desired dashboard, and press “Dashboard Settings.”

2. On the right side menu, Press “Save As…”
 3. Enter the details, and press “Save.”

If you find the Red Hat Virtualization Monitoring portal useful, or have comments, complaints, or other feedback:
-
Open a support case on the Red Hat Customer Portal.
-
Join oVirt community and ask additional questions in oVirt users mailing list or other methods we mentioned.
For additional information:
-
Enabling Grafana integration manually: Configuring Grafana.
-
Full dashboards descriptions can be found in the Administration Guide: Built-in Grafana dashboards.
-
The data available in the data warehouse: Statistics History Views, Configuration History Views.
저자 소개
Litman has been with Red Hat since 2020 and is currently an Associate Software Engineer.
채널별 검색
오토메이션
기술, 팀, 환경을 포괄하는 자동화 플랫폼에 대한 최신 정보
인공지능
고객이 어디서나 AI 워크로드를 실행할 수 있도록 지원하는 플랫폼 업데이트
클라우드 서비스
관리형 클라우드 서비스 포트폴리오에 대해 더 보기
보안
환경과 기술 전반에 걸쳐 리스크를 감소하는 방법에 대한 최신 정보
엣지 컴퓨팅
엣지에서의 운영을 단순화하는 플랫폼 업데이트
인프라
세계적으로 인정받은 기업용 Linux 플랫폼에 대한 최신 정보
애플리케이션
복잡한 애플리케이션에 대한 솔루션 더 보기
오리지널 쇼
엔터프라이즈 기술 분야의 제작자와 리더가 전하는 흥미로운 스토리
제품
- Red Hat Enterprise Linux
- Red Hat OpenShift Enterprise
- Red Hat Ansible Automation Platform
- 클라우드 서비스
- 모든 제품 보기
툴
체험, 구매 & 영업
커뮤니케이션
Red Hat 소개
Red Hat은 Linux, 클라우드, 컨테이너, 쿠버네티스 등을 포함한 글로벌 엔터프라이즈 오픈소스 솔루션 공급업체입니다. Red Hat은 코어 데이터센터에서 네트워크 엣지에 이르기까지 다양한 플랫폼과 환경에서 기업의 업무 편의성을 높여 주는 강화된 기능의 솔루션을 제공합니다.


