红帽博客
This post will show how to gather Apache Spark Metrics with Prometheus and display the metrics with Grafana in OpenShift 3.9. We start with a description of the environment, then show how to set up Spark, Prometheus, and Grafana.
Environment Overview
This is the environment we’re working with. The steps we walk through should apply to slightly newer/older versions of these packages, but it’s possible that you’ll have to tweak things for different releases.
- Red Hat Enterprise Linux 7.5
- OpenShift Container Platform 3.9 Cluster
- Container Runtime: docker-1.13.1
- OpenShift Prometheus 3.9
- Apache Spark 2.3.0/Oshinko 0.5.4
- Grafana 4.7.0-pre1
Part 1: Host Cluster Preparation
Install Red Hat Enterprise Linux 7.5 on all nodes in the cluster, then install OpenShift 3.9 with Openshift Prometheus enabled. Use the host preparation (Section 2.3) and installation guide to install Openshift 3.9 and Openshift Prometheus.
Create an inventory file with prometheus enabled. We've included an example inventory file with Prometheus enabled, single master, single etcd, and multiple nodes:
[OSEv3:children]
masters
nodes
etcd
nfs

[OSEv3:vars]
openshift_release=v3.9
# to obtain the ip address of your router for the default
# subdomain setting
# oc get pod router-1-xbq2t --template={{.status.hostIP}}”
openshift_master_default_subdomain=X.X.X.X.nip.io
openshift_enable_service_catalog=false

openshift_enable_unsupported_configurations=True

#enable NTP
openshift_clock_enabled=true

# Allow any user by default
deployment_type=openshift-enterprise
openshift_master_identity_providers=[{'name': 'htpasswd_auth', \
'login': 'true', 'challenge': 'true', 'kind': 'HTPasswdPasswordIdentityProvider', \
'filename': '/etc/origin/master/htpasswd'}]
ansible_ssh_user=root

# Add multi-tenant sdn
os_sdn_network_plugin_name='redhat/openshift-ovs-multitenant'

# Enable cluster metrics. If you want to turn metrics off,
# just set these to false
openshift_metrics_install_metrics=false

#Enable prometheus
openshift_hosted_prometheus_deploy=true
openshift_prometheus_namespace=openshift-metrics
openshift_prometheus_node_selector={"region":"infra"}

# added for Non-persistent Storage
openshift_metrics_cassandra_storage_type=emptydir

# set up persistent storage for the registry
openshift_hosted_registry_storage_kind=nfs
openshift_hosted_registry_storage_access_modes=['ReadWriteMany']
openshift_hosted_registry_storage_nfs_directory=/exports
openshift_hosted_registry_storage_nfs_options='*(rw,root_squash)'
openshift_hosted_registry_storage_volume_name=registry
openshift_hosted_registry_storage_volume_size=100Gi
openshift_metrics_storage_kind=nfs
openshift_metrics_storage_access_modes=['ReadWriteOnce']
openshift_metrics_storage_nfs_directory=/exports
openshift_metrics_storage_nfs_options='*(rw,root_squash)'
openshift_metrics_storage_volume_name=metrics
openshift_metrics_storage_volume_size=1Gi

# set up prometheus storage
openshift_prometheus_storage_kind=nfs
openshift_prometheus_alertmanager_storage_kind=nfs
openshift_prometheus_alertbuffer_storage_kind=nfs
openshift_prometheus_storage_access_modes=['ReadWriteOnce']
openshift_prometheus_storage_nfs_directory=/exports
openshift_prometheus_storage_nfs_options='*(rw,root_squash)'
openshift_prometheus_storage_volume_name=prometheus
openshift_prometheus_storage_volume_size=10Gi
openshift_prometheus_storage_labels={'storage': 'prometheus'}
openshift_prometheus_storage_type='pvc'

openshift_hosted_etcd_storage_kind=nfs
openshift_hosted_etcd_storage_nfs_options="*(rw,root_squash,sync,no_wdelay)"
openshift_hosted_etcd_storage_nfs_directory=/exports
openshift_hosted_etcd_storage_volume_name=etcd-vol2
openshift_hosted_etcd_storage_access_modes=["ReadWriteOnce"]
openshift_hosted_etcd_storage_volume_size=1G
openshift_hosted_etcd_storage_labels={'storage': 'etcd'}

openshift_logging_storage_kind=nfs
openshift_logging_storage_access_modes=['ReadWriteOnce']
openshift_logging_storage_nfs_directory=/exports
openshift_logging_storage_nfs_options='*(rw,root_squash)'
openshift_logging_storage_volume_name=logging
openshift_logging_storage_volume_size=10Gi

# disable cockpit installation
osm_use_cockpit=false

[masters]
node01.example.com

[etcd]
node01.example.com

[nfs]
node01.example.com

[nodes]
node01.example.com openshift_schedulable=True
node02.example.com openshift_node_labels="{'region': 'primary', \
'zone': 'default'}" openshift_schedulable=False
node03.example.com openshift_node_labels="{'region': 'primary', \
'zone': 'default'}"
node04.example.com openshift_node_labels="{'region': 'primary', \
'zone': 'default'}"
node05.example.com openshift_node_labels="{'region': 'primary', \
'zone': 'default'}"
node06.example.com openshift_node_labels="{'region': 'infra', \
'zone': 'default'}"
node07.example.com openshift_node_labels="{'region': 'primary', \
'zone': 'default'}"
node08.example.com openshift_node_labels="{'region': 'primary', \
'zone': 'default'}"
Part 2: Spark/Oshinko installation
Install Oshinko to obtain containerized Spark with configuration settings which allow you to export Spark metrics. Use these steps on the OpenShift master node.
# oc login -u system:adminSwitch to project openshift-metrics.
# oc project openshift-metricsObtain and install Oshinko Source-to-Image (S2I) templates.
Important Note: the Oshinko-s2i and Oshinko-cli tar files you download must have the same release version, e.g. oshinko_s2i_v0.5.4.tar.gz and oshinko_v0.5.4_linux_adm64.tar.gz as shown in the example here.
# wget https://github.com/radanalyticsio/oshinko-s2i/releases/download/v0.5.4/oshinko_s2i_v0.5.4.tar.gz
# tar xvfz oshinko_s2i_v0.5.4.tar.gz
Create Oshinko S2Itemplates.
# oc create -f release_templates/pythonbuild.json

# oc create -f release_templates/pythonbuilddc.json
# oc create -f release_templates/sparkjob.json
Obtain Oshinko binary to create a cluster which exports spark metrics in JMX format.
# wget https://github.com/radanalyticsio/oshinko-cli/releases/download/v0.5.4/oshinko_v0.5.4_linux_amd64.tar.gz
# tar xvfz oshinko_v0.5.4_linux_adm64.tar.gz
Create "metricsconfig" and "clusterconfig" configmaps to set spark metrics properties.
Start by creating a directory to store your Spark metrics settings. Then you want to create a text file named metrics.properties with these six lines:
*.sink.jmx.class=org.apache.spark.metrics.sink.JmxSink
master.source.jvm.class=org.apache.spark.metrics.source.JvmSource
worker.source.jvm.class=org.apache.spark.metrics.source.JvmSource
driver.source.jvm.class=org.apache.spark.metrics.source.JvmSource
executor.source.jvm.class=org.apache.spark.metrics.source.JvmSource
application.source.jvm.class=org.apache.spark.metrics.source.JvmSource
Now, create the configmaps as shown here.
# oc create configmap metricsconfig --from-file=metrics
# oc create configmap clusterconfig --from-literal=sparkmasterconfig=metricsconfig \

--from-literal=sparkworkerconfig=metricsconfig
Run "oc get configmaps" command to see your configmaps. The output should look like this:
# oc get configmaps
NAME            DATA      AGE

clusterconfig   2         5s
metricsconfig   2         5s
Use the oshinko binary from the tar file to create a Spark cluster with Prometheus metrics enabled. In this example we are creating a Spark cluster with four workers.
# ./oshinko create <yourclusternamehere> --workers=4 \
--metrics=prometheus --storedconfig=clusterconfig
Add spark master and spark worker to Prometheus config map scrape configuration. See figure 1 with scrape configuration changes. You will need the IP addresses of the master and worker pods to include in this static scrape setting. You can find the IP address for each of the master and worker pods by navigating to “applications->pods” in the openshift web user interface (UI) and clicking on the pod name for each of your workers and master pods. In the future we would like to allow the user to label their Spark master and worker so that they will be discovered automatically.

Part 3: Grafana Installation
Download script to install Grafana.
# wget https://github.com/mrsiano/openshift-grafana/archive/master.zip
# unzip master.zip
Change all references to project "grafana" to project "openshift-metrics" in setup_grafana.sh and grafana-ocp.yaml.
Deploy grafana.
# ./setup-grafana.sh prometheus-ocp openshift-metrics true
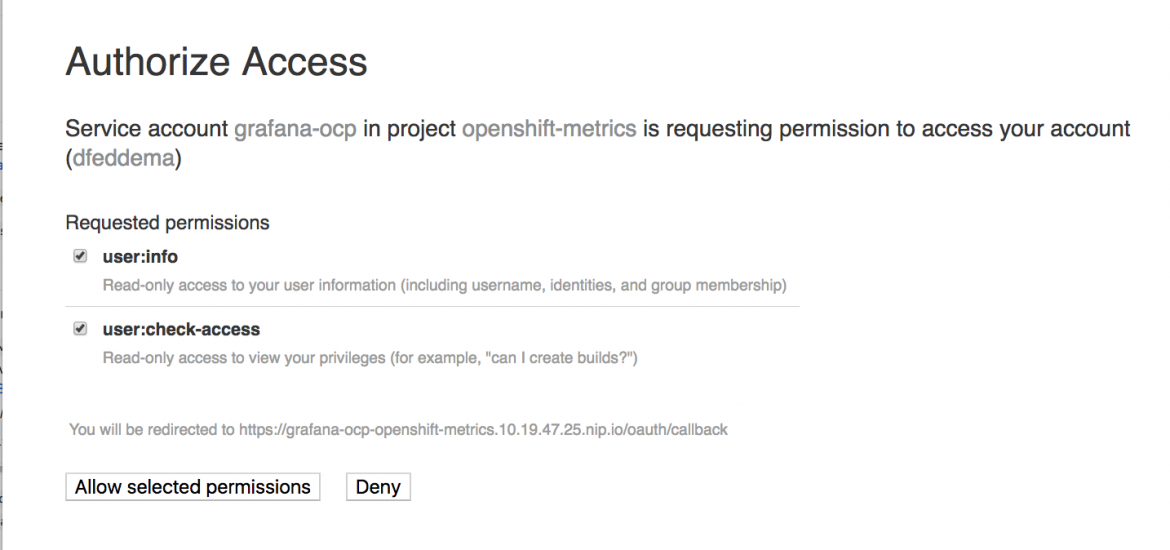
Navigate to the Grafana web UI in the OpenShift console, login in to OpenShift again when prompted allow access to your account by service account grafana-ocp.

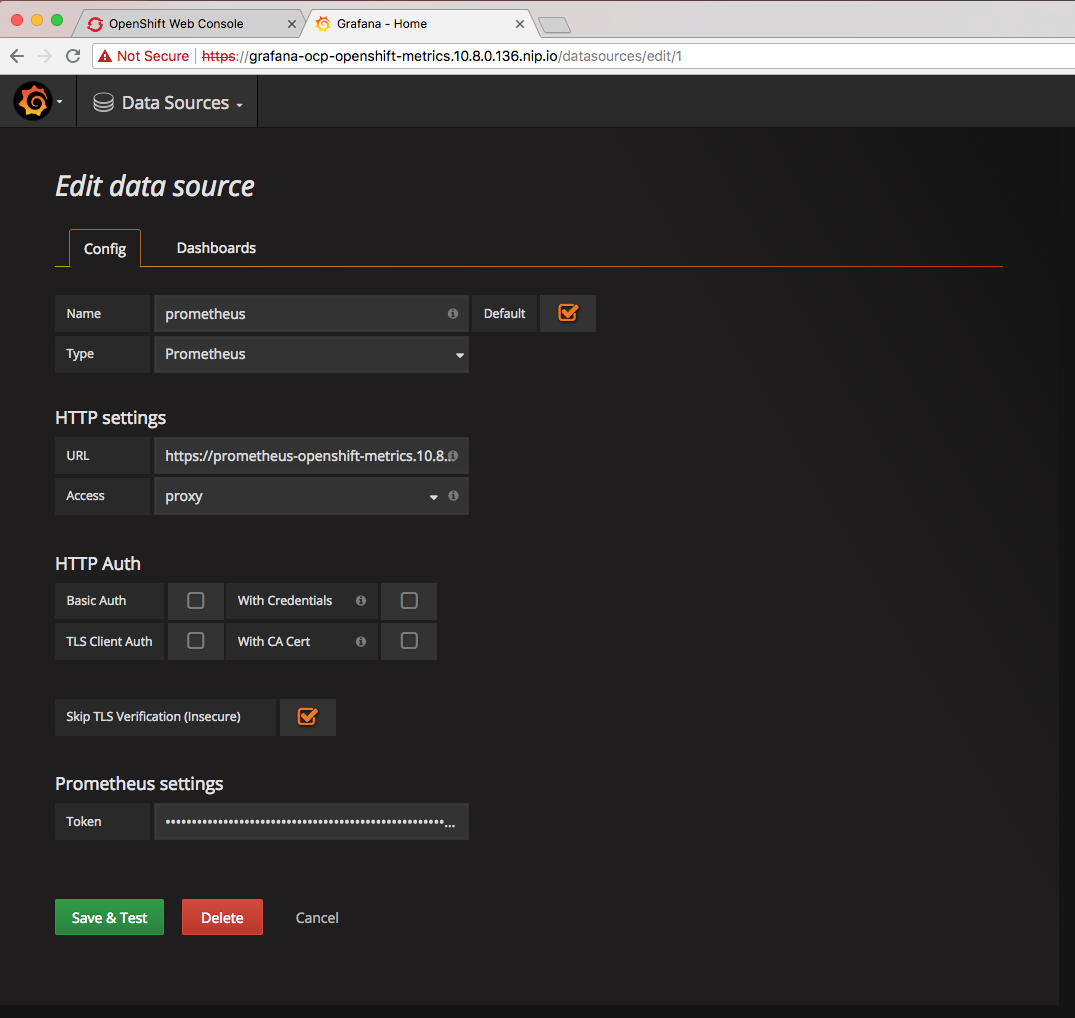
Set up the Grafana datasource configuration as shown in the diagram. You will need to specify name as "prometheus", type as "prometheus", URL as the route for prometheus, e.g. https://prometheus-openshift-metrics.10.8.47.25.nip.io. You look this up via the route tab in the OpenShift web UI. Check the box for "Skip TLS verfication (insecure)". In the OpenShift web UI navigate to "Resources->Secrets" and copy the "token" from the bottom of “grafana-ocp-token-xxxxx” page and paste it into the “Prometheus settings” token on this Grafana data source page.

Part 4: Run a containerized Spark job and create Grafana dashboards to display metrics you collect
Run your Spark job using Oshinko S2I templates. In this example we are using template "oshinko-python-spark-dc". Our Python Spark source code is on GitHub. The S2I template will convert your Python code to a Linux container image.
#! /bin/bash
#
#

APPLICATION_NAME=myapplicationname

APP_FILE=myappplicationname.py

SPARK_OPTIONS=" --driver-java-options \
'-javaagent:/opt/app-root/src/agent-bond.jar=/opt/app-root/src/agent.properties' \
--executor-memory 10G --conf spark.default.parallelism=40"

GIT_URI=https://github.com/yourrepo

GIT_REF=master

OSHINKO_CLUSTER_NAME=yoursparkclustername

CONFIG_MAP=metricsconfig

APP_EXIT=false

        echo "$APPLICATION_NAME"
        echo "$APP_FILE"
        echo "$GIT_URI"
        echo "$GIT_REF"
        echo "$APP_EXIT"
        echo "$OSHINKO_CLUSTER_NAME"
        echo "$APP_ARGS"
        echo "$SPARK_OPTIONS"

     oc new-app --template=oshinko-python-spark-build-dc \
--param=APPLICATION_NAME="$APPLICATION_NAME" \
--param=APP_FILE="$APP_FILE" \
--param=GIT_URI="$GIT_URI" \
--param=GIT_REF="$GIT_REF" \
--param=OSHINKO_SPARK_DRIVER_CONFIG="$CONFIG_MAP" \
--param=OSHINKO_CLUSTER_NAME="$OSHINKO_CLUSTER_NAME" \
--param=SPARK_OPTIONS="$SPARK_OPTIONS"
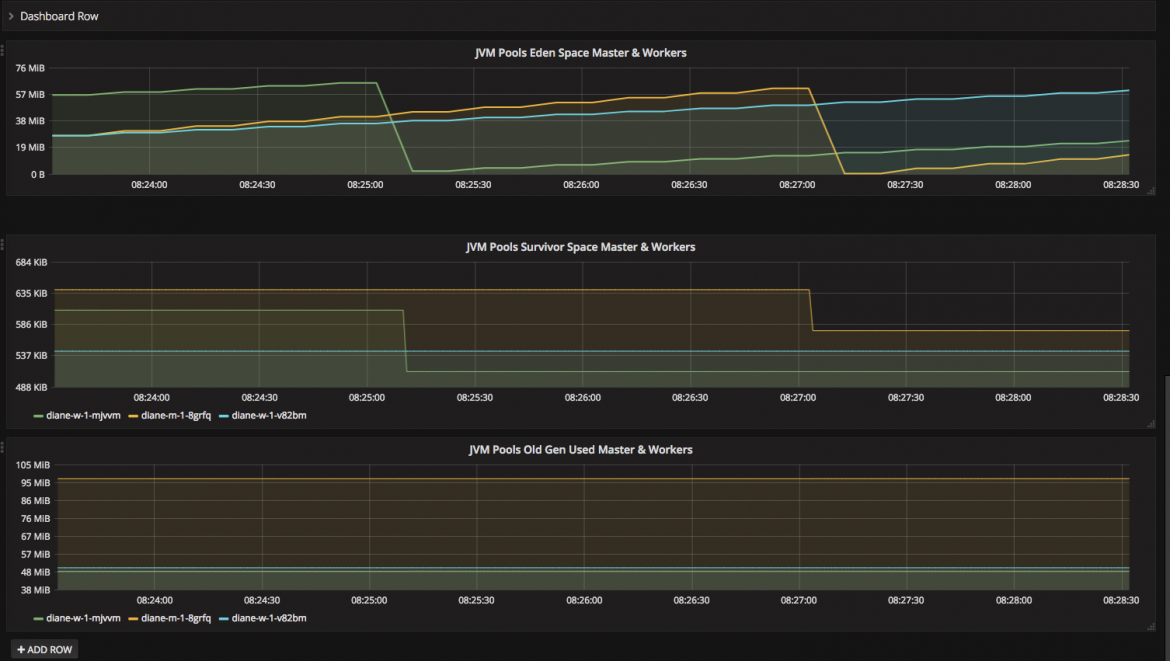
Now you can build our own Grafana dashboards to view metrics for your running Spark job in Grafana. Here is an example dashboard displaying Spark Metrics in Grafana.

Give it a try yourself, we think you'll find this very useful.
About the authors
Diane Feddema is a Principal Software Engineer at Red Hat leading performance analysis and visualization for the Red Hat OpenShift Data Science (RHODS) managed service. She is also a working group chair for the MLCommons Best Practices working group and the CNCF SIG Runtimes working group.

