Red Hat Enterprise Linux (RHEL) 8 can provide significant performance improvements over RHEL 7 across a range of modern workloads. To put this in context, we used RHEL 7.6 to execute multiple benchmarks with Intel's 2nd generation of Intel Xeon Scalable processors, and our hardware partners set 35 new world record performance results using the same OS version. This post will highlight RHEL 8 performance gains over RHEL 7.
How did we get here? The performance engineering team at Red Hat collaborates with software partners and hardware OEMs to measure and optimize performance across workloads that range from high-end databases, NoSQL databases packaged in RHEL, Java applications, and third party databases and applications from Oracle, Microsoft SQL Server, SAS, and SAP HANA ERP applications.
We run multiple benchmarks and measure the performance of CPU, memory, disk I/O and networking. Testing includes the filesystems we ship with Red Hat Enterprise Linux, such as XFS, Ext4, GFS2, Gluster and Ceph.
Microbenchmarks are used to validate expected low level performance on bare metal, using virtualization and containers. We then run optimized application workloads based on industry standard benchmarks from SPEC (cpu_est, jbb_est), TPC (OLTP and DSS) STAC and SAP/SAS [1]. These benchmarks are meant to mimic real application workloads for their respective industries and use cases and provide a standard way to measure and compare application level performance—the performance you actually care about!
To give you an idea about the performance we’ve seen with RHEL 8, we are providing some unofficial numbers from our lab systems. These are numbers measured in May 2019 when RHEL 8 was first shipped. While performance tuning and optimization work will continue with minor releases, the Red Hat Performance team is eager to give you a sense of performance improvements that we have seen and what customers may see on similar workloads.
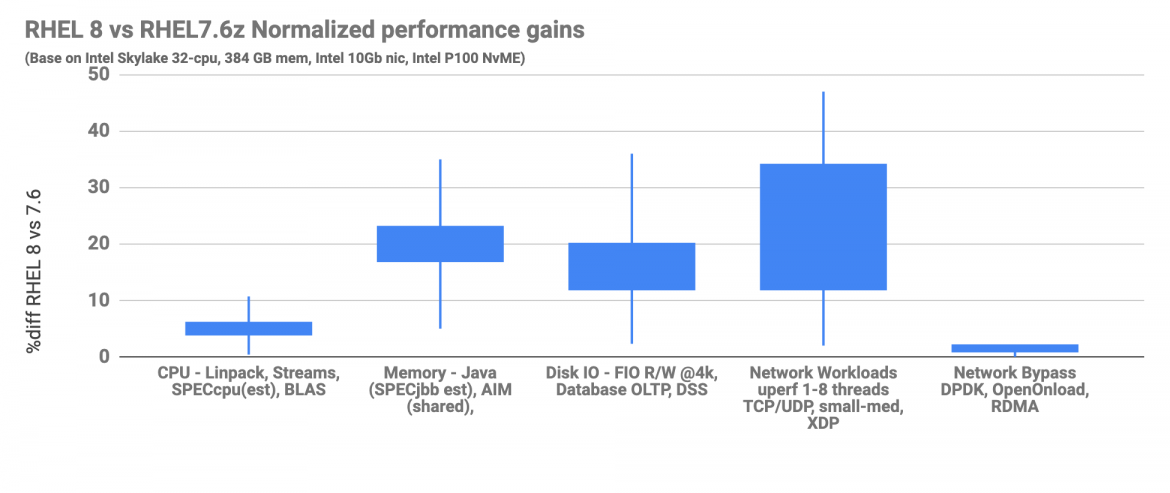
Reading this chart: this is a candlestick chart which combines multiple tests into a single vertical bar. The boxes shows weighted values and the vertical lines show the highest and lowest results. All values are percentage performance improvements from RHEL 7 to RHEL 8. Higher is better.
As shown in the "normalized performance gains" chart, traditional CPU loads like Linpack and SPECcpu (est) are performing similarly to RHEL 7, because they spend a majority of the time in userspace rather than the Linux kernel.
To help you better understand the chart, let’s use disk I/O benchmarks as an example. Workloads like IOzone and FIO benefit from the enhanced versions of multi-path I/O for SCSI. Other improvements include reduced overhead in filesystem logging (XFS/Ext4).

Reading this chart: The two curves show throughput measured in number of jobs per minute against the number of concurrent tasks running. Higher is better.
The AIM7 workloads create user processes that run a mix of Linux operations that can be adjusted to stress performance in compute, database, fileserver, or a shared mix profile. The metric measures throughput in jobs/minute, continuing to add users until the CPU on the server is saturated.
The AIM7 shared mix generally tests the OS system call overheads and the I/O performance of the filesystem. RHEL 7 and RHEL 8 have similar throughput when executing tests with fewer than 500 simulated users. As the number of simulated users increases to 2000 or more, benefits from lower syscall overhead and improvements in the XFS system journaling code found in RHEL 8 become more prominent. At saturation, where you see the chart plateau, RHEL 8 shows 35% greater throughput measured in jobs/min.
The networking stack has been improved in RHEL 8, with measured performance gains of up to 46%. RHEL 8 provides better performance with small and mid-size packets, and comparable performance with large packets.
OpenStack Control Plane Network Performance - 10 GbE Intel NIC
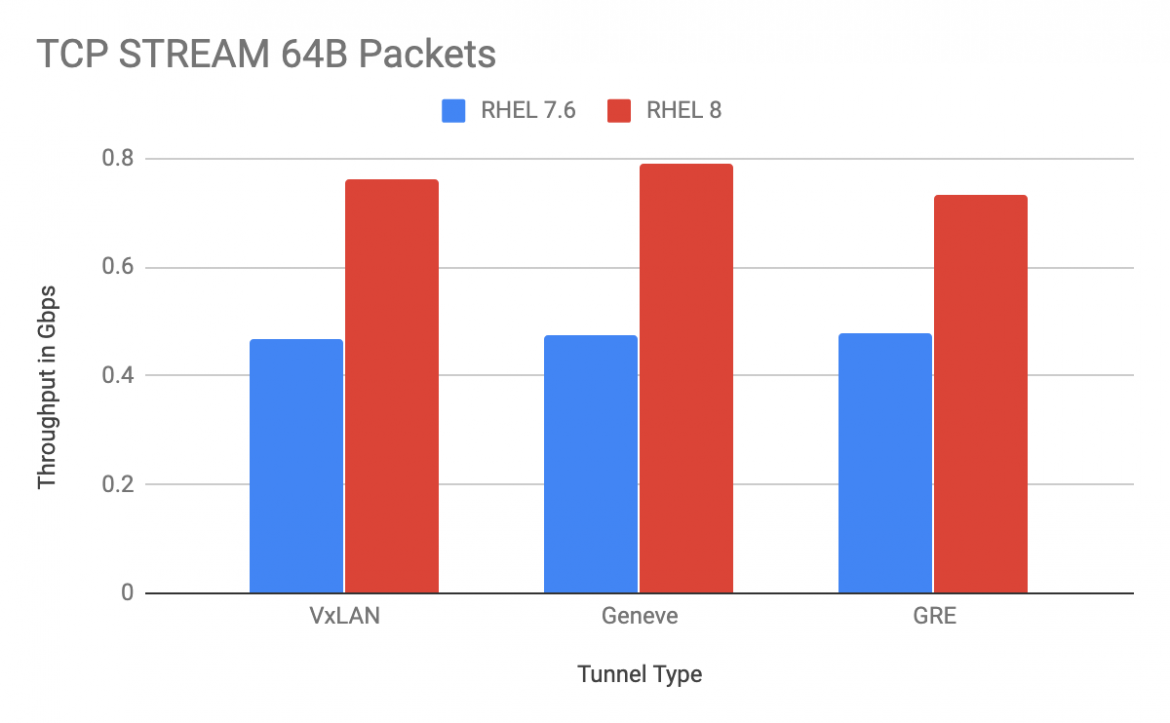
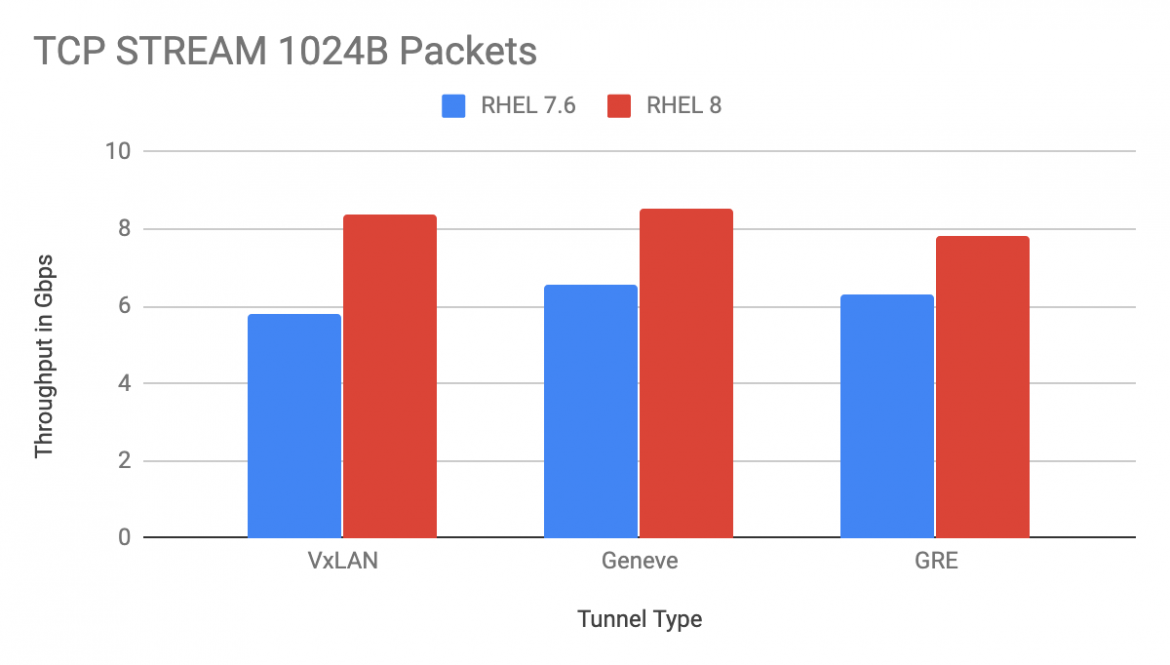
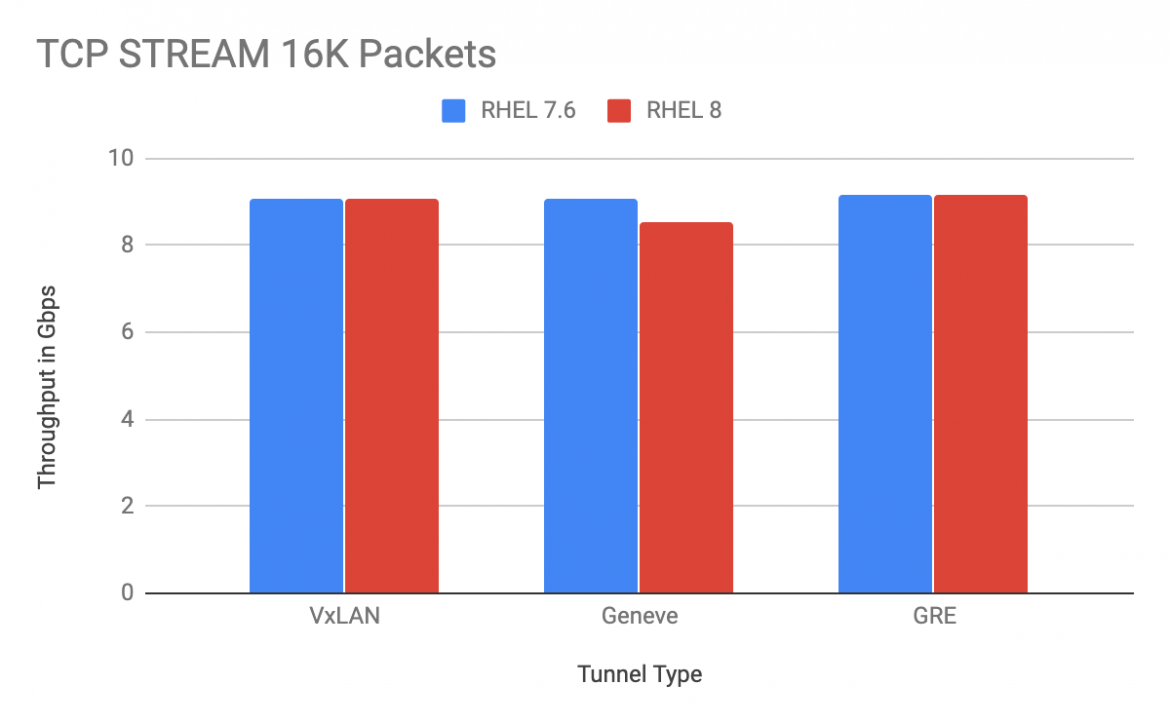
Reading these charts: Higher is better. Performance is measured in Gb/sec with three different packet sizes using 3 different network tunnels. Note that the vertical axis is different for 64 Byte packets, with less than 1 Gb/sec throughput.
We’ve measured datapoints above using uperf, a multi-threaded netperf. We tested 1 and 8 threads in a client server configuration using the network-latency tuned profile. Here we measured gains in TCP/UDP for standard MTU size of 1500 in small (64B) and medium sized (1KB) packet sizes on our Intel 10 Gb Ethernet cards for 3 different tunneling technologies that Red Hat OpenStack uses: VLAN, Geneve and GRE.
Similar gains in networking have been measured on 25 GbE, 40 GbE and 100 GbE adapters from several vendors. As expected, network bypass technologies on RHEL 8 performed within 1-3% of RHEL 7.6 since they are not affected by the kernel changes.
We also tested transaction processing performance using workloads derived from the popular TPC benchmark with the MariaDB database. These results are considered estimates since they are not audited and do not include the large server and I/O requirements of a formal TPC benchmark. In general, we see RHEL 8 providing higher absolute throughput and better scaling that RHEL 7.
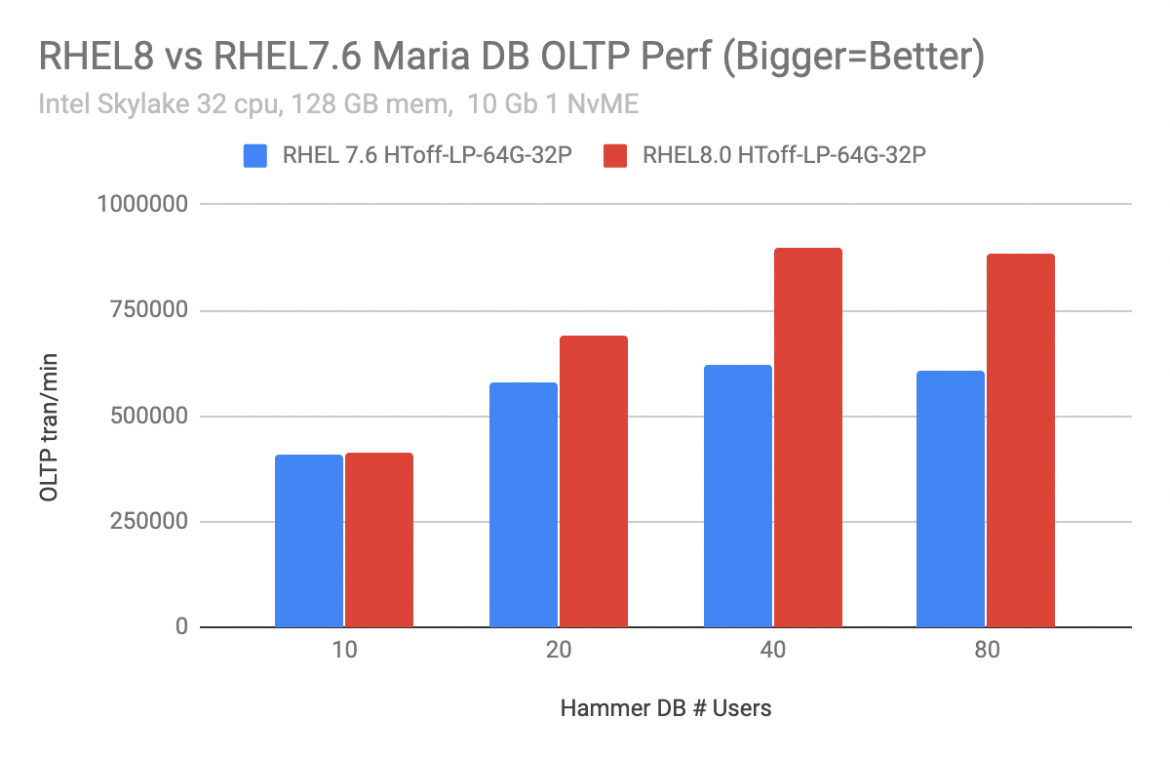
Reading this chart: Throughput is measured in transactions per second against a number of concurrent users. RHEL 8 provides higher absolute throughput and better scaling.
We used HammerDB to drive the workload under different simulated user counts. HammerDB is an open source tool that can be configured to run standard benchmarks like tpcc and tpch against a variety of databases such as MariaDB, PostgreSQL, Oracle or Microsoft SQL Server. The databases typically benefit from improvements in filesystems and multiqueue SCSI operations and thus shows performance gains in RHEL 8.
These benchmark results show that Red Hat Enterprise Linux can excel at handling scalable workloads. We experienced performance improvements across a range of benchmarks and workloads in our in-house benchmarks of RHEL 8 and are working to continue driving additional enhancements throughout the RHEL 8 lifecycle.
Notes: Performance improvements are apples to apples comparison on the same hardware. Most results use the out of the box settings for both RHEL8 and RHEL7.6 which use the tuned throughput-performance profile. The network workloads alter the tuned profile to network-latency. The database performance results using NvME storage utilized tuned latency-performance profile for both RHEL8 and RHEL7.6 results. Customers can further optimize to their use cases by enabling the appropriate tuned profile.
关于作者
产品
工具
试用购买与出售
沟通
关于红帽
我们是世界领先的企业开源解决方案供应商,提供包括 Linux、云、容器和 Kubernetes。我们致力于提供经过安全强化的解决方案,从核心数据中心到网络边缘,让企业能够更轻松地跨平台和环境运营。

