
In my previous article, I explained how to deploy and connect hosts to a simple FleetDM installation for experimentation. FleetDM is an open source tool that centralizes configuration and query management for a fleet of Osquery agents. Osquery allows you to gather performance, capacity, and other essential data about your system using SQL. Using the FleetDM user interface (UI) or command-line interface (CLI), you can submit and schedule queries across all of your Osquery agents, filtering them as needed.
[ Learn how to manage your Linux environment for success. ]
This article shows you how to use the FleetDM UI to set up queries and policies for hosts in an Osquery environment. You will learn how to run both ad-hoc and scheduled queries, and you will see how FleetDM policies can help evaluate standards for compliance across your environment.
You should already have FleetDM deployed to perform the activities in this article. If you haven't installed FleetDM, please follow the instructions from my previous article to set up a non-production installation.
Run a query
The first article in my Osquery series discussed how Osquery can run ad-hoc queries using the interactive osqueryi shell. Running a query from the local system's shell quickly becomes untenable if you want to query many hosts. FleetDM enables you to run queries across all of your Osquery-enabled hosts and aggregate the results for easier processing.
The Query page allows you to define, save, and run queries against your hosts. You can run queries against all your hosts, select a subset of hosts based on their operating system, or manually select individual hosts.
To create and execute a new query, navigate to Queries and select Create new query. The New query dialog allows you to define a query and includes a helpful reference for tables in the Osquery schema. For this example, I'm using the same query from my previous article to find a list of processes and usernames being run by non-root users.
Once you have defined a query, you can save it or run it immediately with the Run query button. FleetDM allows you to filter and select the hosts you want the query to execute against. I only have two hosts connected to FleetDM, so I run it against both by selecting all Linux hosts and clicking Run. The results of the query appear in the web interface as they arrive from connected hosts:
View larger video (Anthony Critelli, CC BY-SA 4.0)
FleetDM's Query page makes it easy to run ad-hoc queries across dozens or hundreds of hosts simultaneously. You can also save commonly used queries so that they are easily accessible in the future. The results can then be accessed directly in the FleetDM user interface (UI) or exported for consumption by other systems.
[ Want to test your sysadmin skills? Take a skills assessment today. ]
Schedule queries
The second article in my OSquery series discussed using scheduled queries to poll information about a system regularly. Scheduled queries are an excellent tool for detecting system changes. Centrally managing scheduled queries provides a way to gain visibility into changes across your entire environment.
FleetDM supports scheduling queries across your Osquery-enabled hosts and forwarding the logs to a central destination. FleetDM supports various destinations, but it uses the filesystem destination by default. This logs scheduled query results to a file on the FleetDM server.
Scheduling a query requires defining a saved query on the Query page using the same steps from the previous section. Instead of running the query, you can save it to execute later. I'll use the same query from above (and my previous article) to find all non-root users on a system.
Once you have defined and saved the query, you can schedule it to run by navigating to Schedule and selecting Schedule a query. The Schedule editor allows you to set the query frequency, define the logging type, and choose the platform that the query executes against. For this example, I scheduled the query to run as a differential snapshot every 15 minutes against all Linux hosts:
View larger video (Anthony Critelli, CC BY-SA 4.0)
To test the query, I create a new user on one of the hosts in my environment:
$ sudo useradd testuser
I can inspect the log file on the FleetDM server after 15 minutes to see the query result:
$ docker exec -it fleetdm_fleet_1 cat /tmp/osquery_result | tail -n 1 | jq
{
  "name": "pack/Global/query_users",
  "hostIdentifier": "b355b92d-9382-4c2d-95e8-a800481902b8",
  "calendarTime": "Tue Dec  6 19:45:24 2022 UTC",
  "unixTime": 1670355924,
  "epoch": 0,
  "counter": 1,
  "numerics": false,
  "decorations": {
    "host_uuid": "b355b92d-9382-4c2d-95e8-a800481902b8",
    "hostname": "fedora-2"
  },
  "columns": {
    "shell": "/bin/bash",
    "uid": "1000",
    "username": "testuser"
  },
  "action": "added"
}
The ability to centrally manage scheduled queries and forward them to a log destination is a great way to simplify the management of your Osquery environment. FleetDM makes this process simple, allowing you to execute queries regularly across thousands of hosts and centralize the results.
Use FleetDM policies
Osquery empowers you to collect a vast amount of information about your systems. FleetDM policies allow you to leverage data from queries to ensure that systems meet your organization's standards. A policy is a query that is regularly evaluated. If the query returns an empty result, then the host is in violation of the policy.
Define a new policy on the Policies page by selecting Add a policy. The policy dialog provides several policies that are included with FleetDM. Define a custom policy by selecting Create your own policy. This launches the New policy dialog, which is nearly identical to the New query dialog from the previous section. The query provided in this dialog evaluates policy compliance.
This example defines a policy that queries the status of SELinux on remote systems:
SELECT value FROM selinux_settings WHERE key = "enforce" AND value = 1;
If SELinux is enabled, the query will return a result, and the host will pass the policy check. If SELinux is disabled, the query will return an empty result, indicating the host is non-compliant. Once the query is defined, select Save to save the policy. The Save policy dialog allows you to specify a policy name and description. You can also choose a resolution for the system owner if a policy violation is encountered and set which target platforms to execute the policy evaluation against:
View larger video (Anthony Critelli, CC BY-SA 4.0)
To test this policy, I can disable SELinux on one of the systems connected to FleetDM:
$ sudo setenforce 0
Policy evaluations occur at the interval defined by the osquery_policy_update_interval configuration parameter. The Docker Compose file for my lab environment defines a very low value of 30 seconds for testing purposes. After about 30 seconds, FleetDM indicates that one of the hosts is failing the policy evaluation:
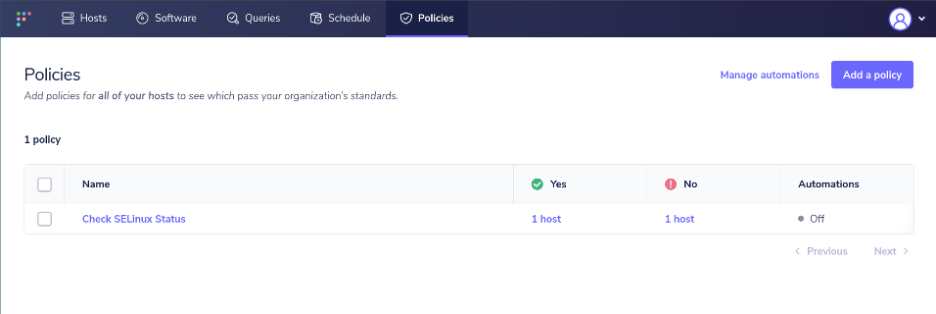
Policies are a powerful feature in FleetDM that helps you identify potential problems with your systems. You can even trigger automations based on policy violation results, enabling you to generate a ticket for manual intervention or take automatic corrective action. Having this functionality built into FleetDM allows you to avoid the complexity of forwarding Osquery logs to an external system and constructing alerts based on these logs. Instead, you can use query results to trigger policy violations and take corrective action directly.
[ Keep your most commonly used commands handy with the Linux commands cheat sheet . ]
Wrap up
In this article, you saw how FleetDM provides a comprehensive management platform for an Osquery environment. You learned how to execute ad-hoc and scheduled queries, and you saw how FleetDM policies enable you to leverage query results to understand the compliance state of your environment. By combining the power of Osquery with the management capabilities of FleetDM, you can rapidly scale your ability to understand the state of your systems.
About the author
Anthony Critelli is a Linux systems engineer with interests in automation, containerization, tracing, and performance. He started his professional career as a network engineer and eventually made the switch to the Linux systems side of IT. He holds a B.S. and an M.S. from the Rochester Institute of Technology.
More like this
Achieve high scalability using Red Hat Satellite Capsule Server
Debunking IT automation myths: A strategic blueprint for healthcare payers
Untangling Networks | Compiler
Operating System Management | Compiler
Browse by channel

Automation
The latest on IT automation for tech, teams, and environments

Artificial intelligence
Updates on the platforms that free customers to run AI workloads anywhere

Open hybrid cloud
Explore how we build a more flexible future with hybrid cloud

Security
The latest on how we reduce risks across environments and technologies

Edge computing
Updates on the platforms that simplify operations at the edge

Infrastructure
The latest on the world’s leading enterprise Linux platform

Applications
Inside our solutions to the toughest application challenges
Virtualization
The future of enterprise virtualization for your workloads on-premise or across clouds