The latest release of the Red Hat OpenShift cluster observability operator 1.3 introduces observability signal correlation, incident detection, application performance monitoring (APM) dashboard, and more. These features aim to revolutionize how organizations monitor, troubleshoot, and maintain containerized environments by reducing complexity and accelerating issue resolution.
Cluster observability operator 1.3
Advanced observability capabilities in Red Hat OpenShift have evolved significantly, with the 1.3 release introducing the general availability of two features to help organizations monitor, troubleshoot, and maintain their containerized environments:
- Observability signal correlation
- Incident detection for Red Hat OpenShift
Both observability signal correlation and incident detection are integral components of Red Hat's observability troubleshooting journey initiative. This structured approach is designed to improve the efficiency and effectiveness of identifying and resolving issues within OpenShift clusters through a comprehensive suite of analytics features.
All in all, the cluster observability operator (COO) serves as the deployment and management platform for these advanced observability features. The operator provides highly customizable monitoring stacks that complement the default OpenShift monitoring capabilities, offering enterprise-level functionality including long-term data retention, advanced analytics, and multi-tenancy support.
These capabilities collectively transform OpenShift observability from reactive monitoring to proactive, intelligent operations management, providing organizations with the tools needed to maintain high-performance, reliable containerized environments at scale.
Observability signal correlation for Red Hat OpenShift
Observability signal correlation for Red Hat OpenShift is now generally available. This feature is powered by Korrel8r, an open source correlation engine founded within Red Hat. This technology enables automatic correlation of multiple observability signals across heterogeneous data stores, including metrics from Prometheus/Thanos, logs from Loki, alerts from Alertmanager, and cluster resources from the Kubernetes API server. The correlations are then rendered in a dedicated troubleshooting panel in the OpenShift web console.
The correlation capability operates as a rule-based correlation engine with an extensible rule set that can navigate diverse signal types, data models, naming conventions, and query languages stored across multiple data stores. Korrel8r rules describe relationships between signals, allowing the engine to search for goal data related to a start signal through chains of correlation rules.
With this GA release, users benefit from:
- Troubleshooting panel: An interactive node graph interface within the OpenShift web console that simplifies observability signal navigation. Click nodes to be redirected to the relevant web console UI displaying specific information about pods, deployments, metrics, or logs.
- Multi-signal support: The system correlates an expanded range of signals including netflows, in addition to traditional metrics, traces, logs (including OpenTelemetry), and alerts. This comprehensive coverage enables more thorough root cause analysis across different data domains.
- Flexible access points: Access the troubleshooting panel through multiple entry points, including the traditional Observe > Alerting UI and the application launcher menu in the OpenShift web console masthead.
- Configurable investigation depth: The system provides visibility into Korrel8r's queries with options to select investigation depth, allowing users to focus on specific starting signals and customize the scope of their correlation analysis.
Incident detection for Red Hat OpenShift
The Incident detection capability in Red Hat OpenShift addresses the critical challenge of alert storms in distributed systems. When infrastructure issues occur, they typically generate cascades of related alerts rather than single notifications, making it difficult to identify root causes amid the noise.
The incident detection system uses analytics-driven alert grouping based primarily on temporal correlation between events. Alerts that occur around the same time are grouped into incidents through various heuristics, transforming dozens of individual alerts into manageable incident timelines.
With this GA release, users benefit from:
- Alert grouping engine: The system observes incoming alerts and assigns them to groups called incidents using temporal correlation algorithms. This grouping data is available as Prometheus metrics and integrated into the OpenShift web console through the cluster observability operator.
- Component-based analysis: Beyond simple alert grouping, the system maps alerts to different OpenShift components and ranks them by criticality from an overall cluster health perspective. This component ranking helps prioritize troubleshooting efforts, ensuring teams focus on the most impactful issues first.
- Timeline visualization: The incidents UI (part of the Alerting UI) provides color-coded incident timelines by severity, allowing you to inspect specific alerts and understand the evolution of incidents over time. The severity of an incident reflects the maximum severity among its constituent alerts and can vary as conditions change.
- Intelligent prioritization: Components are ranked by importance, enabling administrators to focus on critical infrastructure elements like etcd before addressing secondary issues. This prioritization is based on the potential impact each component has on overall system stability.
- Multi-perspective analysis: The system offers both timeline and component-based views, allowing you to analyze incidents from different angles depending on your troubleshooting approach. This flexibility accommodates various operational workflows and user preferences.
Integrate incident detection with OpenShift Lightspeed
With the brand new incident detection MCP server released as a developer preview, incident detection for Red Hat OpenShift can now also integrate with OpenShift Lightspeed, the generative AI-based virtual assistant. This integration revolutionizes how users investigate and resolve OpenShift cluster issues and can be tested as a developer preview with COO 1.2.2 and above.
Incident detection for Red Hat OpenShift simplifies observability by grouping related alerts into incidents, reducing alert fatigue and helping users pinpoint root causes of issues. By bringing this incident data directly into the OpenShift Lightspeed's conversational AI interface, you can now query for information about your cluster, asking natural language questions to explore event relationships and deep dive into specific symptoms.
For example, you can investigate a particular symptom within your cluster by asking questions such as "Is my cluster healthy?" or "Are there any incidents firing?" and you instantly receive a response.
An article explaining all the steps that need to be taken to test this new integration is now available.
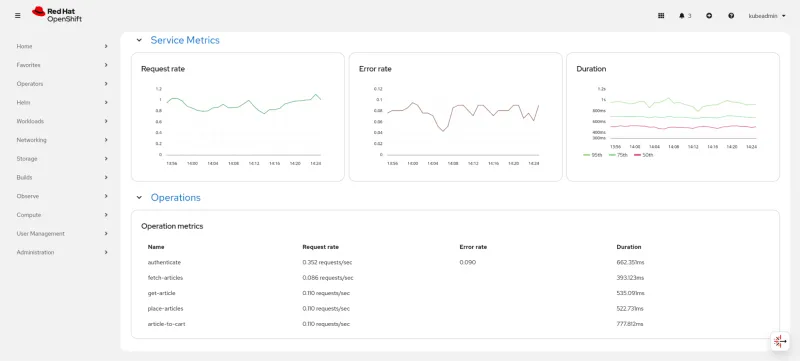
APM dashboard with Red Hat Distributed Tracing
A new application performance monitoring (APM) dashboard is available as a developer preview with the cluster observability operator 1.3 release. The APM dashboard, populated by Red Hat distributed tracing platform, is a critical tool for site reliability engineers (SRE), DevOps teams, and developers. It allows users to:
- Monitor overall health: Quickly see the status of an entire application fleet at a glance
- Identify bottlenecks: Pinpoint specific services causing slowdowns
- Accelerate root cause analysis: More easily move from a high-level metric anomaly down to the individual trace that caused the problem
The dashboard is powered by Perses, an observability dashboarding framework currently being integrated in the OpenShift web console, and provides you with more flexibility and dashboard customization opportunities.
OpenShift monitoring
Monitoring in OpenShift 4.20 arrives with a range of enhancements that make troubleshooting, security, and performance tracking more powerful and flexible than ever, whether you're running a single cluster or managing fleets at scale.
- Expanded node-level metrics: Diagnosing network-related issues often requires deep insight into kernel-level behavior. OpenShift 4.20 introduces support for the
sysctlnode-exporter collector, giving operators and SREs direct access to low-level networking metrics within Prometheus. - Enhanced KSM metric configuration: The kube-state-metrics (KSM) component now supports multi-tenancy for custom resource (CR) state metrics, enabling greater scalability and flexibility across large or multi-team clusters. With this improvement, OpenShift Monitoring can now handle diverse workloads and custom resources more efficiently. This marks an important step forward in cluster observability maturity.
- Adjustable metric-server verbosity: Debugging and tuning just got easier! Operators can now adjust the log verbosity of the metric-server directly, offering granular control over how much diagnostic detail is available during live troubleshooting. It's a small but impactful quality-of-life enhancement that streamlines investigation workflows without requiring a restart or complex configuration changes.
- Enhanced network security: Security is at the core of every OpenShift release. In 4.20, we added NetworkPolicy support for monitoring components, allowing administrators to enforce strict network boundaries between observability services.
This enhancement aligns with zero-trust best practices ensuring that data collected by the monitoring stack remains isolated, protected, and fully compliant with internal security policies.
OpenShift logging
Logging 6.4 is here, packed with exciting new features designed to streamline operations, boost security, and simplify troubleshooting for your cloud-native applications.
Streamlined storage with AWS S3 output
Managing vast volumes of logs, especially audit logs that often exceed typical size limits, can be a real challenge. Logging 6.4 provides streamlined AWS S3 output for ACS Cloud Service logs. This update enables cost effective, high-volume storage with long retention and flexible tiering capabilities by leveraging the robust features of AWS S3. It includes an enhancement with ClusterLogForwarder API, updated documentation, and a ClusterLogForward that fully supports AWS S3 output (with flexible bucket, region, and prefix key templating) and AWS STS authorization.
Enhanced CloudWatch and S3 Integration with Flexible Authentication
We're committed to making authentication even more robust and consistent across all our services. With Logging 6.4, we're expanding the assumeRole authentication option in CloudWatch to support both iamRole and awsAccessKey types. This enhancement not only ensures consistent authentication logic but also lays the groundwork for future, seamless S3 integration. Key features include:
- External ID support: Enhance security by using externalID with both iamRole and awsAccessKey types.
- Robust validation: New assumeRole field validation helps ensure proper configuration and security.
- Seamless S3 integration (forthcoming): This update paves the way for a more streamlined and secure integration with S3.
Loki performance troubleshooting made simple
Query performance issues can be a major source of frustration when you're dealing with critical logs. Logging 6.4 introduces a dedicated troubleshooting guide for Loki query performance. This comprehensive guide outlines how to identify bottlenecks, adjust parameters, and differentiate between Loki, network, and storage-related issues. It also references an upstream article and provides Red Hat's recommended steps and metrics, making it easier than ever to get your logging system running optimally.
Smarter monitoring with Loki conditional alerting rules
Stay ahead of potential problems with smarter monitoring using Loki conditional alerting rules. This innovative feature allows you to create more intelligent and precise alerts based on specific conditions within your Loki logs. This means you can respond faster to critical events and maintain the health of your applications with greater precision.
These updates in Logging 6.4 demonstrate our unwavering commitment to providing a powerful, secure, and user-friendly platform for your cloud-native workloads. Stay tuned for more details and start exploring these new capabilities today!
OpenTelemetry and Tracing
In Red Hat distributed tracing 3.7, we are offering new features that bring increased stability to customers, while also adding in functionality that is essential to understanding how requests flow across services.
Red Hat Build of OpenTelemetry
In this release, the Red Hat Build of OpenTelemetry is offering native sidecar support in OpenShift 4.16 and later. In this mode, a collector container is deployed within the same pod as your application, and acts as a local telemetry processor for your observability signals. There are several benefits to running in native sidecar mode:
- Native lifecycle: Integrates with the Kubernetes native sidecar feature for better lifecycle control
- Lower latency: Signals travel within the pod before they are exported
- Decoupling: Telemetry is separated from the application, so operational burden is reduced
We're also offering a technical preview of the Probabilistic Sampling Processor in this release. With this processor, users can sample traces based on a per-request sampling percentage. Using this processor, users can reduce their storage costs because only a fraction of the traces are stored, but users are still getting a representative overview of system behavior. Sampling only a percentage also lowers processing load, while still ensuring that the traces collected aren’t biased towards "noisy" or error prone traces.
Tempo Operator
In the Red Hat distributed tracing 3.7 release, the Tempo Operator has been upgraded from Tempo 2.7.2 to Tempo 2.8.2. There are several major features in this upgrade:
- A new TraceQL metric function can compute the sum of metrics over time
- TraceQL query hints can have Tempo return the most recent traces ordered by start time
- A new TraceQL intrinsic (built-in span or trace property) was created to search on
span:parentID
New observability features in Red Hat Advanced Cluster Management for Kubernetes
Red Hat Advanced Cluster Management for Kubernetes significantly enhances the operational landscape for organizations managing complex, distributed Kubernetes environments. Its core strength lies in providing robust multicluster observability capabilities, which are crucial for overcoming the challenges associated with disparate clusters. Observability is a key component in the Red Hat Advanced Cluster Management for Kubernetes and with the latest 2.15 release, we're announcing a significant improvement:
Right-sizing for virtualization (Technology Preview)
Rightsizing at the virtual machines (VM) level is now available as a technology preview with Red Hat Advanced Cluster Management for Kubernetes 2.15. Right-sizing recommendations for Red Hat OpenShift Virtualization involves analyzing the actual resource usage (CPU and memory) of a VM to optimally adjust its allocated resources. This means scaling resources up or down to precisely match the specific demands of the workload. The goal of right sizing is to enhance performance, cut costs by eliminating over-provisioned resources, and boost overall efficiency. This feature, part of MCO, allows users to make informed decisions about appropriate resource scaling.
Here's why right-sizing is essential:
- Focus on cost optimization: Organizations can achieve additional savings by aligning resource allocation with actual usage, thereby avoiding expenditures on unnecessary or underutilized capacity.
- Provide performance improvement: Right-sizing helps resolve performance bottlenecks by guaranteeing that VMs have sufficient resources to meet workload requirements, which prevents resource contention.
- Boost efficient resource utilization: Right-sizing maximizes the use of the underlying physical infrastructure, improving utilization rates and reducing wasted capacity.
- Promote a positive environmental impact: Efficient and lean infrastructure helps reduce unnecessary energy consumption, contributing to sustainability goals.
Read more about right-sizing recommendations in this article by Darshan Vandra and Raj Zalavadia. You can also benefit from right-sizing recommendations at the namespace and cluster levels, released as technology preview with Red Hat Advanced Cluster Management for Kubernetes 2.14.
Explore the new features
Ready to explore these new features? Visit the redhat.com/observability and documentation pages to learn more and get started with the latest observability tools in OpenShift. The Red Hat Developers Observability page also contains information to help you learn about and implement observability capabilities.
We value your feedback! Share your thoughts and suggestions using the Red Hat OpenShift feedback form.
关于作者

Roger Florén, a dynamic and forward-thinking leader, currently serves as the Principal Product Manager at Red Hat, specializing in Observability. His journey in the tech industry is marked by high performance and ambition, transitioning from a senior developer role to a principal product manager. With a strong foundation in technical skills, Roger is constantly driven by curiosity and innovation. At Red Hat, Roger leads the Observability platform team, working closely with in-cluster monitoring teams and contributing to the development of products like Prometheus, AlertManager, Thanos and Observatorium. His expertise extends to coaching, product strategy, interpersonal skills, technical design, IT strategy and agile project management.

Jamie Parker is a Product Manager at Red Hat who specializes in Observability, particularly in the Logging and OpenStack areas. At Red Hat, Jamie works with organizations and customers to learn about their needs within the ever changing Observability landscape, and based on their feedback, helps to guide upcoming products within the Red Hat Observability Platform. Jamie enjoys sharing lessons learned to the community by frequently speaking at meetups and conferences, and by blogging.

Vanessa is a Senior Product Manager in the Observability group at Red Hat, focusing on both OpenShift Analytics and Observability UI. She is particularly interested in turning observability signals into answers. She loves to combine her passions: data and languages.


