With the upcoming release of the Red Hat Ansible Automation Platform there are now included Software as a Service (SaaS) offerings, one of which is Automation Analytics. This application provides a visual dashboard, health notifications and organization statistics for your Ansible Automation. Automation Analytics works across multiple Ansible Tower clusters allowing holistic analytics across your entire infrastructure.
When talking to the community and our customers, a question that often comes up is: “How do we measure success?”. Automation Analytics provides key data on Job Template usage, Ansible Module usage, organizational comparisons across your enterprise, and much more. This data can be used to assess usage, success criteria, and even charge backs between different groups. This blog post will outline how to get started with Automation Analytics and start collecting data right away.
What you need to get started:
- Red Hat Ansible Tower 3.5.3 or newer
- An active Red Hat Ansible Automation Platform subscription
- A Red Hat Ansible Tower instance that can reach https://cloud.redhat.com
Ansible Automation Platform terminology
There are some terms used in this blog post that may be unfamiliar for folks new to the Red Hat Ansible Automation Platform. In addition to the Ansible Engine glossary and the Ansible Tower glossary I want to outline some quick terms to help folks understand this post:
- cluster - A single installation of Red Hat Ansible Tower. This can be a single host or dozens. Automation Analytics treats each independent installation of Red Hat Ansible Tower as a single entity.
- control node - The node where Ansible Automation is executed from. Within a cluster this can be any node that is part of the same cluster.
- SaaS - Software as a Service. For this post this refers to software that Red Hat hosts and runs versus software that a customer runs on their own infrastructure. There are multiple SaaS offerings available on cloud.redhat.com, but we are strictly talking about Automation Analytics.
- organization - this refers specifically to the terminology in Red Hat Ansible Tower. An Ansible Tower organization is a logical collection of Users, Teams, Projects, and Inventories. It is the highest level in the Tower object hierarchy.
Activating Data Collection
First login to your Red Hat Ansible Tower web UI (user interface). The user account must have administrative privileges to turn on data collection. Click on the Settings button on the left menu. If the menu is in compact mode there will only be a small gear representing the settings.
![]()
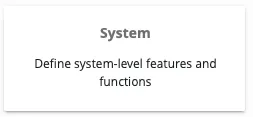
Next click on the System button:

There are three settings you need to set under Settings->System:
- GATHER DATA FOR AUTOMATION INSIGHTS must be set to ON
- The name “Automation Insights” may be different depending on the version of Red Hat Ansible Tower you are running. The name Automation Insights is an older name for the SaaS known as Automation Analytics. This software is not the same as Red Hat Insights and this name change took place to help differentiate the two different SaaS tools on cloud.redhat.com.
- RED HAT CUSTOMER USERNAME is your cloud.redhat.com username.
- RED HAT CUSTOMER PASSWORD is your cloud.redhat.com password for the corresponding username.
Here is an example snippet of the Settings>System page:

Finally, click the SAVE button:
![]()
Once this is saved, Red Hat Ansible Tower will sync to cloud.redhat.com up to four times a day. At the time of writing this blog post this is not configurable.
Manual Data Collection
If it is desired to sync to cloud.redhat.com right away and register a system, this can be done manually on the Red Hat Ansible Tower command line. This will allow you to verify quickly that everything is setup correctly.
Login as the awx user or an administrative user on the control node and run the following command:
$ sudo awx-manage gather_analytics --ship
This command will provide output similar to the following:
[student1@ansible ~]$ sudo awx-manage gather_analytics --ship
/tmp/4457cd25-4722-4b62-9ae6-ce8068026bbc_2019-10-28-155420+0000.tar.gz
shipping analytics file: /tmp/4457cd25-4722-4b62-9ae6-ce8068026bbc_2019-10-28-155420+0000.tar.gz
[student1@ansible ~]$
Do not worry about re-running the command multiple times. The syncing tool is non-destructive (you will not lose data) and will not upload redundant data. No matter how many times you run the gather_analytics command the data set will remain the same on cloud.redhat.com.
Verifying Ansible Tower is syncing
Login to your cloud.redhat.com account. Look for the Red Hat Ansible Automation Platform card:

Click on the Automation Analytics link to go directly to the Automation Analytics dashboard.
If no Ansible Tower Clusters are syncing to cloud.redhat.com you will get a box displaying No Data Found. The screen will look like the following:

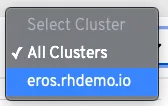
If data has synced successfully to cloud.redhat.com the name will show up under the All Cluster drop down menu on the right side of the web UI. Here is an example of my Ansible Tower Cluster eros.rhdemo.io:

The name found within cloud.redhat.com will correspond to the value under the BASE URL OF THE TOWER HOST. In this case the Ansible Tower URL is https://eros.rhdemo.io.
Exploring Automation Analytics
Now given this is a newly registered system there will not be much data in cloud.redhat.com until several days pass. The first time you register a system and turn on automation analytics it will upload the last four weeks of activity. The Ansible Tower dashboard will not match the automation analytics dashboard one-to-one because Ansible Tower Management Jobs are filtered out. Examples of filtered jobs include Cleanup Activity Stream and Cleanup Job Details. You can find documentation of these Management Jobs here. There are three distinct parts of Automation Analytics at the time of writing this blog post:
- Analytics dashboard - Reveals the most used Ansible Playbooks, modules and deployment pass/fail rates from an intuitive dashboard.

The Automation Analytics dashboard (shown above as a screen shot) can filter based on time for the past week, two weeks or last month (as of the writing of this blog post). It is also possible to filter by an individual cluster:

When filtering by an individual cluster, the graph will change from a bar graph into a line graph showing Ansible Tower Job Template passes versus failure. The automation analytics dashboard is the default view when you access Automation Analytics on cloud.redhat.com, and defaults to a seven day time period for all clusters. It can be accessed by clicking the Clusters link on the left navigation menu.
- Health notifications - Stay informed with relevant health notifications for your Ansible Automation, including license utilization alerts and cluster outages

Health notifications are displayed in their own pane in the analytics dashboard. These provide important information about individual cluster health. These include notifications such as:
- Ansible Tower Cluster is down
- Last time data was updated
These health notifications are extremely pluggable and as more data is collected, Red Hat can provide more notifications and alerts based on customer feedback. Please talk to your Red Hat account team about notifications that you would find important.
- Organization Statistics - Visualize how groups within an organization consume and use automation across an enterprise.

Just like with the Analytics dashboard it is possible to filter by time, going back over the last month. In addition, Organizational Statistics makes it possible to filter by individual organization, and toggle multiple organizations at the same time.
There are also two pie graphs in panels below the main line graph comparison tool. Job Runs by Organization refers to the total amount of Job Templates executed by an organization and then comparing that holistically across all organizations. Usage by Organization (Tasks) refers to an individual task within a Job Template. This allows an administrator to compare organizations that use large Job Templates with many tasks versus an Ansible Tower Organization that uses many Job Templates that have just a few tasks each.
Going Further
We highly encourage you to turn on Automation Analytics today and start gaining useful data around your automation. Curious about what data automation analytics will collect across your Ansible Tower deployments? Read this FAQ around Security and Data Handling for Automation Analytics, detailing how you can control which data is collected, where it is held, and for how long. This tool was developed jointly with customers to help bring their automation to the next level and allow employees to engage with different groups and personas at an enterprise level.
For example, it could potentially be fun to gamify the amount of automation one organization is using to help encourage other groups to start contributing and automating more.. Another great use-case would allow the group hosting Ansible Tower Clusters to perform chargebacks to other groups due to the value they are providing organizations within their company. Finally it might be beneficial to see all the top modules being used because you might notice non-stateful shell and command modules being used in situations when there is a better way with a dedicated Ansible Module.
In addition, here are some additional links to help you in your automation journey:
- Documentation on Automation Analytics
- Upcoming webinar detailing Automation Analytics
- Red Hat Ansible Automation Platform Workshops
- Ansible Automates events
Also check out the next post in this series: Getting Started with Automation Analytics: Part 2
关于作者
Sean is a Principal Technical Marketing Manager, Ansible, where he brings over 10 years of experience building and automating computer networks. Sean previously worked for both Cumulus Networks (acquired by Nvidia) and Cisco Systems where he helped customers deploy, manage and automate their network infrastructure. He resides in Chapel Hill, NC with his wife and children and tweets from @IPvSean.
