Performance analysis of computer systems is often considered black art. It requires significant experience with the operating system, applications, networking and diagnostic tools. This is a vast amount of ground to cover and it is nearly impossible for anyone to know it all (though I am fortunate to have met many Red Hatters who seem to have mastered all of the above!).
As if it were not difficult enough, most operating systems have their own diagnostic tools and utilities to extract performance information. Yes, there are many common tools that have been ported to various platforms, but they are often quirky with inconsistent output or parameters. I’m referring to vmstat, iostat, netstat, tcpdump, etc. The SysStat (SAR) tools and service brought us close to a unified and standardized service that collects almost all of the data on a regular basis. However, it has limits regarding the granularity of collected data and can not capture per-process metrics at all. Most frustrating is that the data is collected in binary format that becomes incompatible on other platforms and versions. While the data can be converted, it can be a significant hurdle under pressure at 3:00 a.m. or to novice users.
Enter Performance Co-Pilot (PCP), a system performance and analysis framework that is modularized and easy to extend. Numerous plugins and APIs are available to integrate the data collection into your custom monitoring solution or other common monitoring tools. There is multiplatform support for VMware, Windows and Mac, as well as agents for common applications and devices such as Oracle DB, PostgreSQL, Cisco devices and much more.
Beginning with versions 6.5 and 7.0 of Red Hat Enterprise Linux, PCP is included in the base software channels. Going forward it is intended as standard tool to provide performance related diagnostic metrics.
Overview
Without going too deep into the theory, PCP has three primary parts:
Performance Metric Domain Agents (pmda)
These are the various agents, collecting data from the given domain or subsystem (kernel, memory, storage, DB application, etc).
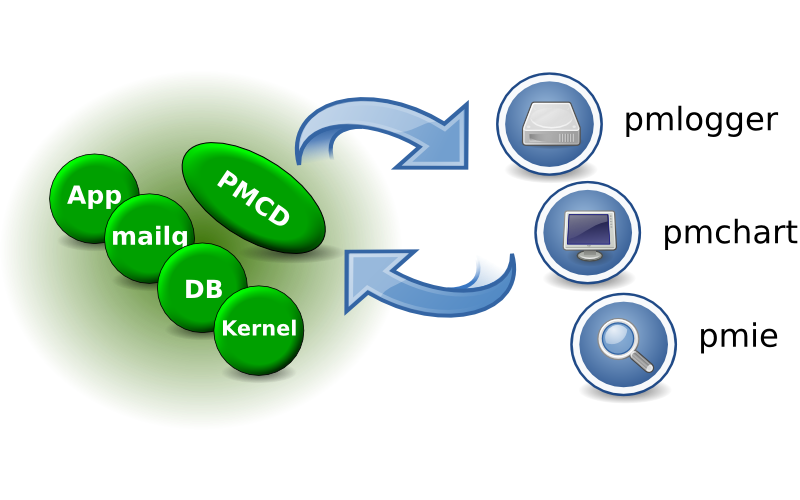
Performance Metric Collection Daemon
This is the service daemon that controls the various pmdas and acts as a router for clients to request data from the service.
Clients
These are the various clients that would request the data in order to log to storage (local or remote) or present to a user via a graphical or command line interface.
Getting started
To get started collecting metrics as a service (similar to the SAR/Sysstat service), just type the following simple commands in Red Hat Enterprise Linux 7:
yum install pcp

systemctl enable pmcd

systemctl start pmcd

systemctl enable pmlogger

systemctl start pmlogger
Next, you can test various commands that are very similar to other utilities you are probably familiar with in order to see an overview of system activity.
pmstat like vmstat

pmiostat like iostat

pmatop like top enhanced
Here is a basic example of pmatop

Or go deep examining thousands of precision metrics
pmval -t 1 -s 3 network.interface.in.bytes


metric:    network.interface.in.bytes

host:      rhel7

semantics: cumulative counter (converting to rate)

units:     byte (converting to byte / sec)

samples:   3

interval:  1.00 sec


             eth0                    lo               docker0

            118.0                   0.0                   0.0

             65.97                  0.0                   0.0

            118.0                   0.0                   0.0
Because it runs as a service like SAR/SysStat (with up to 1 second precision* unlike SAR/Sysstat), you can examine historical data to help you troubleshoot prior performance.
pmval -a ./20161129  -t 30 -S "Nov 29 08:00" -T "Nov 29 08:05"  network.interface.in.bytes

metric:    network.interface.in.bytes

archive:   ./20161129

host:      rhel7

start:     Tue Nov 29 08:00:00 2016

end:       Tue Nov 29 08:05:00 2016

semantics: cumulative counter (converting to rate)

units:     byte (converting to byte / sec)

samples:   11

interval:  30.00 sec

                         eth0                    lo               docker0

08:00:30.000              26.53                  0.0                   0.0

08:01:00.000              26.00                  0.0                   0.0

08:01:30.000              26.00                  0.0                   0.0

08:02:00.000              26.00                  0.0                   0.0

08:02:30.000              26.00                  0.0                   0.0

08:03:00.000              26.00                  0.0                   0.0

08:03:30.000              27.33                  0.0                   0.0

08:04:00.000              28.20                  0.0                   0.0

08:04:30.000              26.87                  0.0                   0.0

08:05:00.000              26.00                  0.0                   0.0
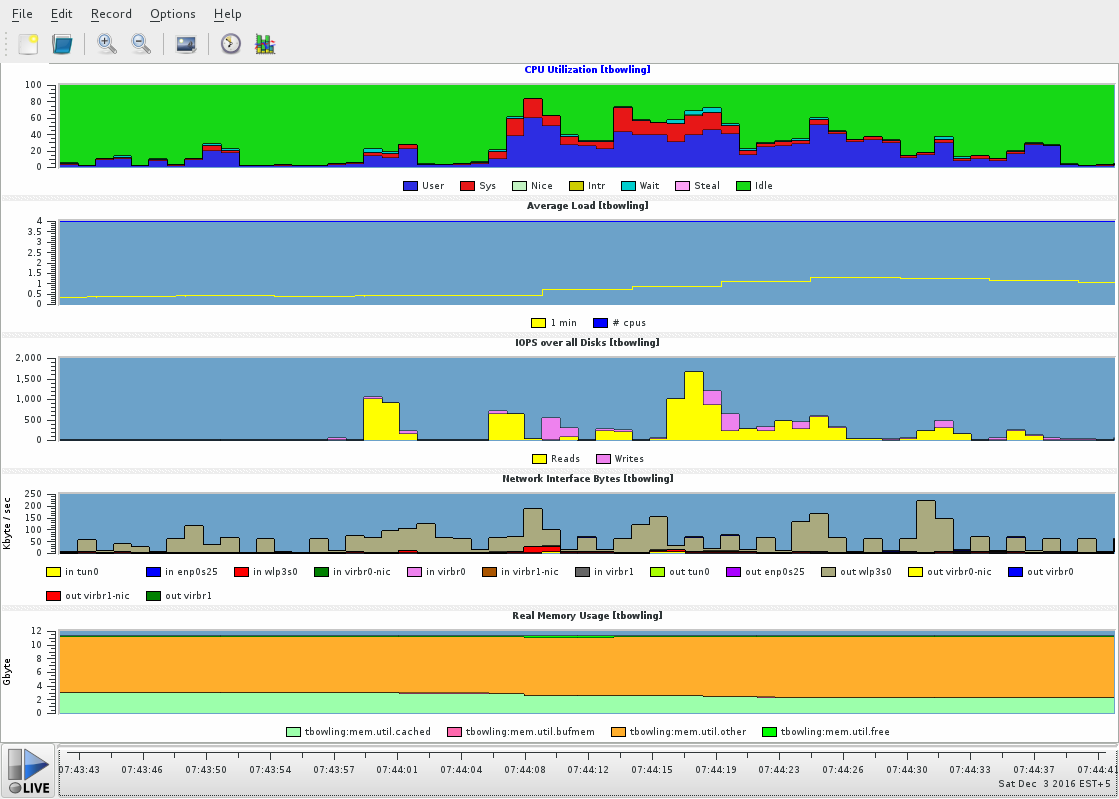
Graphical representation
PCP also excels over the traditional SysStat/SAR tooling with multiple graphical presentation options. The client app pmcharts (or PCP Charts) act as a local client program that can present data collected from the local host, a remote host, or archive files. Numerous default reports are provided and the Overview report gives a nice dashboard of the system. While the graphics are not the most elegant, they are very functional and and easy to use for analysis.
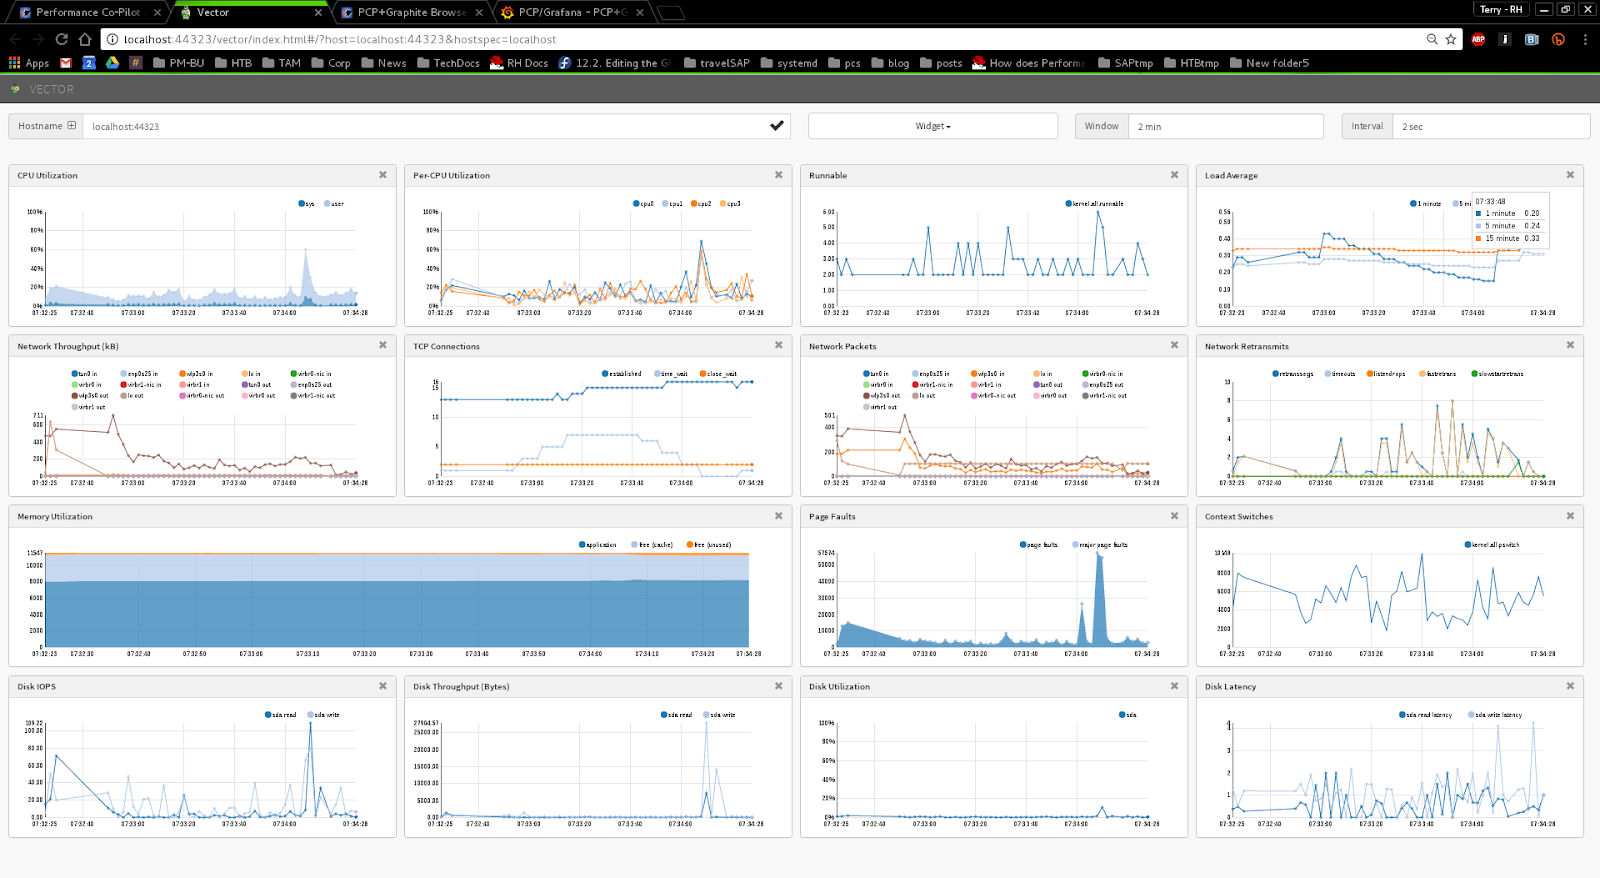
There are a few more elegant graphical options including “Vector” (https://github.com/Netflix/vector) which was contributed by our friends at Netflix. Installing the following packages will give you multiple frameworks to experiment with.
yum install pcp-webjs pcp-webapp-vector pcp-webapp-grafana pcp-webapp-graphite
After installing, point your browser to the landing page (http://localhost:44323/index.html) which provides links to each of the frameworks and a nice summary. You can click on the link for Vector to see its excellent default dashboard.
As you dig into the many options and metrics available, you will quickly see that there is a tremendous amount of performance information at your fingertips. And the PCP website provides multiple case study examples of analysis to help you get started using the tool.

Twitter: https://twitter.com/terry_bowling #RHTAM
A Red Hat Technical Account Manager (TAM) is a specialized product expert who works collaboratively with IT organizations to strategically plan for successful deployments and help realize optimal performance and growth. The TAM is part of Red Hat’s world class Customer Experience and Engagement organization and provides proactive advice and guidance to help you identify and address potential problems before they occur. Should a problem arise, your TAM will own the issue and engage the best resources to resolve it as quickly as possible with minimal disruption to your business.
关于作者

Terry Bowling has been designing and administering UNIX and GNU/Linux environments since 1999. He brings this experience to the Red Hat Enterprise Linux (RHEL) and Insights Product Management teams to provide help streamline the assembling, deployment, and management of RHEL for our customers. Experience it today at redhat.com/image-builder.


