With the BlueStore OSD backend, Red Hat Ceph Storage gained a new capability known as “on-the-fly data compression” that helps save disk space. Compression can be enabled or disabled on each Ceph pool created on BlueStore OSDs. In addition to this, using the Ceph CLI the compression algorithm and mode can be changed anytime, regardless of whether the pool contains data or not. In this blog we will take a deep dive into BlueStore’s compression mechanism and understand its impact on performance.
Whether data in BlueStore is compressed is determined by a combination of the compression mode and any hints associated with a write operation. The different compression modes provided by BlueStore are:
-
none: Never compress data.
-
passive: Do not compress data unless the write operation has a compressible hint set.
-
aggressive: Compress data unless the write operation has an incompressible hint set.
-
force: Try to compress data no matter what. Uses compression under all circumstances even if the clients hint that the data is not compressible.
The compression_mode, compression_algorithm, compression_required_ratio, compression_min-blob_size, and compresion_max_blob_size parameters can be set either via a per-pool property or a global config option. The Pool properties can be set with:
ceph osd pool set <pool-name> compression_algorithm <algorithm>
ceph osd pool set <pool-name> compression_mode <mode>
ceph osd pool set <pool-name> compression_required_ratio <ratio>
ceph osd pool set <pool-name> compression_min_blob_size <size>
ceph osd pool set <pool-name> compression_max_blob_size <size>
Bluestore Compression Internals
Bluestore won’t compress any write that is equal or less than the configured min_alloc_size. In a deployment with default values the min_alloc_size for SSDs is 16KiB and 64 KiB for HDDs. In our case we are using all-flash(SSDs) media and there would be no compression attempt by Ceph with IOs under 32KiB in size.
To be able to test compression performance at smaller blocks sizes, we re-deployed our Ceph cluster with a min_alloc_size of 4KiB, with this modification of Ceph’s configuration we were able to achieve compression with 8KiB block sizes.
Please take into account that modifying the min_alloc_size from the default configuration in a Ceph cluster has an impact on the performance. In our case where we decrease the size from 16 KiB to 4KiB we are modifying the datapath for 8KiB and 16KiB block sized IOs, they will no longer be a deferred write and go to the WAL device first, any block bigger than 4KiB will be directly written into the OSD configured block device.
Bluestore Compression configuration and testing methodology
To understand the performance aspect of BlueStore compression, we ran several tests as described below:
1. 40 instances running on Red Hat Openstack Platform 10 with one Cinder volume attached per instance(40xRBD volumes). We then created and mounted a XFS filesystem using the attached Cinder volume.
2. 84xRBD volumes using the FIO libRBD IOengine.
Pbench-Fio was used as a benchmarking tool of choice, with 3 new FIO parameters (below) to ensure that FIO would generate a compressible dataset during the test.
refill_buffers
buffer_compress_percentage=80
buffer_pattern=0xdeadface
We ran the tests using Aggressive compression mode, so that we would compress all objects unless the client hints that they are not compressible. The following Ceph bluestore compression global options were used during the tests
bluestore_compression_algorithm: snappy
bluestore_compression_mode: aggressive
bluestore_compression_required_ratio: .875
The bluestore_compression_required_ratio is the key tunable parameter here, which is calculated as
bluestore_compression_required_ratio = Size_Compressed / Size_Original
The default value is 0.875, which means that if the compression does not reduce the size by at least 12.5%, the object will not be compressed. Objects above this ratio will not be stored compressed because of low net gain.
To know the amount of compression that we are achieving during our FIO synthetic dataset tests we are using four Ceph perf metrics:
-
Bluestore_compressed_original. Sum for original bytes that were compressed.
-
Bluestore_compressed_allocated. Sum for bytes allocated for compressed data.
-
Compress_success_count. Sum for beneficial compress operation.
-
Compress_rejected_count. Sum for compress ops rejected due to low net gain of space.
To query the current value of the above mentioned perf metrics we can for example use the Ceph perf dump command against one of our running osds:
ceph daemon osd.X perf dump | grep -E '(compress_.*_count|bluestore_compressed_)'
Key metrics that have been measured from the client side during the compression benchmarking:
-
IOPS. The aggregate number of completed IO operations per second
-
Average Latency. Average time needed to complete an IO operation by the client.
-
P95%. Percentile 95% of Latency.
-
P99%. Percentile 99% of Latency.
Test Lab Configuration
The test lab consists of 5 x RHCS all-flash (NVMe) servers and 7 x client nodes, the detailed hardware, and software configurations are shown in table 1 and 2 respectively. Please refer to this blog post, for more details about Lab Setup.


Small Block : FIO Synthetic Benchmarking
It’s important to take into account that the space savings you can achieve with Bluestore compression are entirely dependent on the compressibility of the application workload as well as the compression mode used. As such for 8KB block size and 40 RBD volumes with aggressive compression we have achieved the following compress_success_count and compress_rejected_count.
  "compress_success_count": 48190908,
  "compress_rejected_count": 26669868,
Out of the 74860776 total number of write requests performed by our dataset (8KB) , we were able to successfully compress 48190908 write requests, so the percentage of write requests that were successfully compressed in our synthetic dataset was 64%.
Looking at the bluestore_compressed_allocated and bluestore_comprperformance counters, we can see that the 64% of write operations that were successful compressed translated into saving 60Gb of space per OSD thanks to Bluestore compression.
"bluestore_compressed_allocated": 60988112896
"bluestore_compressed_original": 121976225792
As shown in chart-1/table-1, when comparing Aggressive-Compression to No-Compression, we have observed single digit IOPS percentage drop, which is not very significant. At the same time average and tail latency was found to be slightly higher. One of the reasons for this performance tax could be that, Ceph BlueStore compresses each object blob to match compression_required_ratio and then sends the acknowledge back to client. As a result we see slight reduction in IOPS and increase in average and tail latency when compression is set to aggressive.

Chart 1: FIO 100% write test - 40 RBD Volumes

As shown in chart 2, we tried to increase the load on the cluster by running FIO against 84 RBD volumes from both aggressive-compressed pool and non-compressed pool. We observed a similar performance difference as shown in chart-1. BlueStore compression imposes a slight performance tax compared to no compression. Practically this is to be expected from any storage system that claims to provide on-the-fly compression capabilities.

Chart 2: FIO 100% Random Read / Random Write test - 84 RBD Volumes
Compression also has a computing cost associated with it. The data compression is being done by algorithm like snappy and zstd, which require CPU cycles to compress the original blobs and store them. As shown in chart-3, with smaller block size (8K) the CPU utilization delta between aggressive compression and no-compression was found to be lower. This delta increases as we increase the block size to 16K/32K/1M. One of the reasons could be, with larger block sizes the compression algorithm needs to do more work in order to compress the blob and store, resulting in higher CPU consumption.

Chart 3: FIO 100% Random Write test - 84 RBD Volumes (IOPS vs CPU % Utilization)
Large Block (1MB) : FIO Synthetic Benchmarking
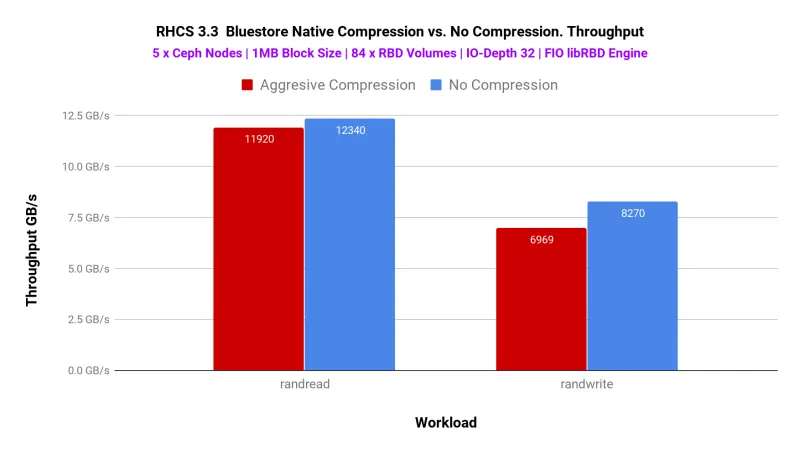
Similar to a small block size, we have also tested large block size workloads with different compression modes. As such we have tested aggressive, force and no-compression modes. As shown in chart 4, the aggregated throughput of aggressive and force modes are very comparable, we haven’t observed significant performance differences. Other than random read workload, there is a large performance difference between compressed (aggressive / force) to that of non-compressed mode, across random read-write and random write pattern.

Chart 4: FIO 1MB - 40 RBD Volumes
In order to assert more load on the system, we used libRBD FIO IO engine and spawned 84 RBD volumes. The performance of this test is shown in chart 5.

Chart 5: FIO 1MB - 84 RBD Volumes
Bluestore compression on MySQL Database Pool
So far we have discussed about synthetic performance testing based on FIO, automated by PBench-Fio. To understand the performance implication of BlueStore compression in a close-to-real production workload, we tested multiple MySQL database instances performance on a compressed and uncompressed storage pool.
MySQL Test Methodology
Bluestore was configured in the same way as in the previous tests, using the snappy algorithm and aggressive compression mode. We deployed 20 VM instances on OpenStack, which were hosted on 5 compute nodes. Out of these 20 VM instances, 10 VMs were used as MySQL database instances, while remaining 10 instances were MySQL database clients, as such creating 1:1 relationship between DB instance and DB client.

The 10xMariadb servers were provisioned with 1x100GB RBD volume through Cinder and mounted on /var/lib/mysql. The volume was preconditioned by writing the full block device using the dd tool before creating the filesystem and mounting it.
/dev/mapper/APLIvg00-lv_mariadb_data 99G 8.6G 91G 9% /var/lib/mysql
The MariaDB configuration file used during the testing is available in this gist. The Dataset was created on each database, using the sysbench command, described below.
sysbench oltp_write_only --threads=64 --table_size=50000000 --mysql-host=$i --mysql-db=sysbench --mysql-user=sysbench --mysql-password=secret --db-driver=mysql --mysql_storage_engine=innodb prepare
Post dataset creation the following three types of tests were run:
-
Read
-
Write
-
Read_Write
Before each test the mariadb instances were restarted to clear the innodb cache, each test was run during 900 seconds and repeated 2 times and the results captured were the average of the 2 runs.
MySQL Test Results
The space savings you can achieve with Bluestore compression are entirely dependent on the compressibility of the application workload as well as the compression mode used.
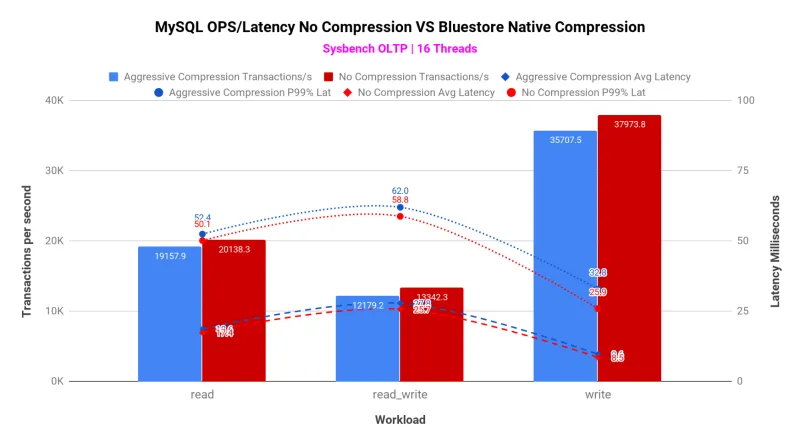
With the Mysql compression tests the combination of the Sysbench generated dataset and the bluestore default compression_required_ratio(0.875) with aggressive compression, we have achieved the following success and rejected count.
compress_success_count: 594148,
compress_rejected_count: 1991191,
bluestore_compressed_allocated: 200351744,
bluestore_compressed_original: 400703488,
With the help of Ceph-metrics we monitored the system resources on the OSD nodes during the MySQL tests. The average cpu usage of the OSD nodes was found to be under south of 14% and the disk utilization under 9% range.The disk latency was found to be under ~2 ms average with isolated spikes staying in single digits.
As shown in chart 6, MySQL transactions per second (TPS) were not found to be severely affected by BlueStore compression. BlueStore aggressive compression did show a minor performance tax compared to no-compression for both TPS and transactional latencies.

Chart 6: BlueStore compression on MySQL database pool
Key Takeaways
-
BlueStore Compression enabled pools showed only 10% performance reduction for FIO based synthetic workload and only 7% reduction for MySQL database workload, compared to non-compressed pools. This reduction is attributed to the underlying algorithms performing data compression.
-
With small block size (8K) the CPU utilization delta between aggressive compression and no-compression mode was found to be lower. This delta increases as we increase the block size (16K/32K/1M)
-
Low administrative overhead while enabling compression on Ceph pools. Ceph CLI out-of-the-box, provided all the required capabilities for enabling compression.
