The recent article JBoss EAP XP 6 is here announced the release of JBoss EAP XP 6.0, which introduced full compliance with MicroProfile 7.0 and a host of new features. Among the most significant updates is the enhanced observability provided by the support for MicroProfile Telemetry 2.0. In this article, I demonstrate how to utilize these observability features to visualize application traces running on JBoss EAP XP 6.0, using the official Quickstart application to walk through the setup procedures for two scenarios:
- Local development environment: A setup using Podman and the installation manager
- Production/Cloud environment: Deployment using Red Hat OpenShift and Helm charts
OpenTelemetry in action
For this article, I used the opentelemetry-tracing application included in the official JBoss EAP Quickstarts. This application is configured to automatically collect traces for JAX-RS requests and send them to a remote OpenTelemetry collector.
You can clone the code from GitHub:
$ git clone \
https://github.com/jboss-developer/jboss-eap-quickstarts.git
$ cd jboss-eap-quickstarts/opentelemetry-tracing
Scenario 1: Local environment (Podman + Standalone)
For the development phase, a robust configuration involves using Podman to run the back-end services while running JBoss EAP XP 6.0 on the host machine.
Step 1: Infrastructure setup (Podman)
First, launch Jaeger (the observability back end) and the OpenTelemetry collector so you can create a dedicated network to ensure smooth container-to-container communication.
Create a dedicated network:
$ podman network create otel-netStart Jaeger (all-in-one):
$ podman run -d --name jaeger \
  --network otel-net \
  -e COLLECTOR_OTLP_ENABLED=true \
  -p 16686:16686 \
  docker.io/jaegertracing/all-in-one:latest
Next, start the OpenTelemetry collector. In this example, we're configuring the collector to receive data from JBoss EAP and forward it to Jaeger:
$ podman run -d --name otel-collector \
  --network otel-net \
  -p 4317:4317 \
  -p 4318:4318 \
  -e OTEL_EXPORTER_OTLP_ENDPOINT=http://jaeger:4317 \
  docker.io/otel/opentelemetry-collector:latest
Step 2: Install and configure JBoss EAP XP 6.0
Use the installation manager to set up the JBoss EAP XP 6.0 environment.
First, install JBoss EAP XP 6.0 using the installation manager included with the JBoss EAP 8.0 installer, applying the XP 6.0 profile:
$ EAP_HOME/bin/jboss-eap-installation-manager.sh install \
--profile eap-xp-6.0 --dir ~/eap-xp6
Start the server:
$ cd ~/eap-xp6
$ ./bin/standalone.sh
To configure the OpenTelemetry subsystem, open a separate terminal and use the management command-line interface (jboss-cli.sh) to enable the OpenTelemetry extension and configure the Collector endpoint:
$ ./bin/jboss-cli.sh --connect
/extension=org.wildfly.extension.opentelemetry:add
/subsystem=opentelemetry:add( \
    service-name=quickstart-local, \
    exporter-type=otlp, \
    endpoint=http://localhost:4317 \
)
reload
Step 3: Deploy and verify
Now build and deploy the Quickstart application:
$ git clone \ https://github.com/jboss-developer/jboss-eap-quickstarts.git
$ cd jboss-eap-quickstarts/opentelemetry-tracing
$ mvn clean package wildfly:deploy
To verify your work, access the endpoint using a browser or curl to generate traces:
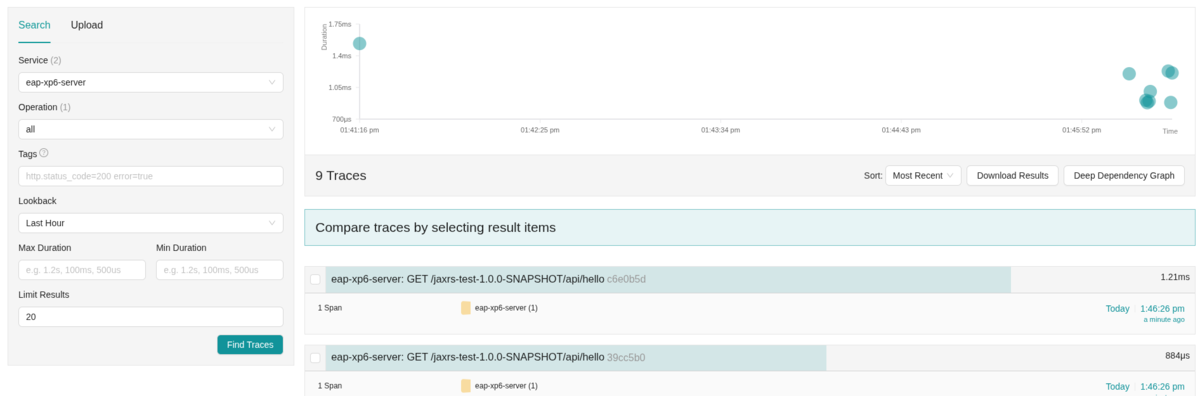
$ curl http://localhost:8080/opentelemetry-tracing/Then access the Jaeger UI at http://localhost:16686 and verify that traces for the opentelemetry-tracing service have been recorded.
Scenario 2: Setup on Red Hat OpenShift
For a production-like environment on Red Hat OpenShift, you can leverage Helm charts to build and deploy the JBoss EAP XP 6.0 application.
Prerequisites
- Red Hat OpenShift distributed tracing platform (Jaeger) must be available on your OpenShift cluster
- Helm CLI must be installed
Step 1: Prepare the OpenTelemetry collector
You must deploy a collector on OpenShift to forward data from the application to Jaeger. Create and apply the following manifest (otel-collector.yaml):
apiVersion: opentelemetry.io/v1beta1
kind: OpenTelemetryCollector
metadata:
  name: otel
spec:
  mode: deployment
  config:
    receivers:
      otlp:
        protocols:
          grpc:
            endpoint: 0.0.0.0:4317
          http:
            endpoint: 0.0.0.0:4318
    exporters:
      otlp:
        endpoint: "jaeger-collector.openshift-distributed-tracing.svc:4317" # Adjust based on your environment
        tls:
          insecure: true
    service:
      pipelines:
        traces:
          receivers: [otlp]
          exporters: [otlp]
Apply the configuration:
oc apply -f otel-collector.yamlStep 2: Configure the Helm chart
Use the JBoss EAP XP 6.0 Helm chart to perform a source-to-image (S2I) build. Create a helm.yaml file to point directly to the Quickstart repository:
build:
  uri: https://github.com/jboss-developer/jboss-eap-quickstarts.git
  ref: xp-6.0.x  # Specify the appropriate branch for XP 6.0
  contextDir: opentelemetry-tracing
  mode: s2i
deploy:
  replicas: 1
  env:
    - name: OTEL_SERVICE_NAME
      value: "eap-xp-on-ocp"
    # Point to the Collector Service created in the previous step
    - name: OTEL_EXPORTER_OTLP_ENDPOINT
      value: "http://otel-collector:4317"
    - name: OTEL_EXPORTER_OTLP_PROTOCOL
      value: "grpc"
Step 3: Execute deployment
When you deploy the application, the Helm chart retrieves the source code from the specified Git repository, executes the Maven build, and creates the container image.
$ helm repo add jboss-eap https://jbossas.github.io/eap-charts/
$ helm install otel-app -f helm.yaml jboss-eap/eap-xp6
Step 4: Verify
Once the deployment is complete, access the application using the route. First, obtain the application URL, and then use curl to visit it.
$ HOST=$(oc get route otel-app --template='{{ .spec.host }}')
$ curl https://$HOST/
Navigate to Observe > Traces in the OpenShift Console (or your Jaeger UI) to confirm that traces are being recorded under the service name eap-xp-on-ocp.
Summary
JBoss EAP XP 6.0 has dramatically simplified the implementation of observability through its full support for MicroProfile Telemetry.
- In a local environment, you can maintain a traditional development style while testing the latest features using the Installation Manager and Podman.
- In an OpenShift environment, combining Helm Charts with S2I allows you to deploy directly from source code into a cloud-native observable environment.
I encourage you to try the opentelemetry-tracing quickstart and experience the capabilities of JBoss EAP XP 6.0 for yourself.
关于作者

Keishi Suzumura is a Senior Technical Account Manager and Team Lead at Red Hat. Since joining the company in 2012, he has focused on Middleware solutions, providing technical guidance and advocacy for his customers.


