In this post:
Red Hat Insights for Red Hat Ansible Automation Platform ships with six reports. See what data you can glean from them and how to share them as PDFs with other stakeholders.
See how to access Automation Savings Planner, Automation Calculator and more useful tools within Red Hat Insights for Red Hat Ansible Automation Platform.
Red Hat Ansible Automation Platform is a framework for building and operating IT automation at scale. The platform includes many of the tools you’ll need to implement automation across your organization, allowing you to simplify and centralize control of your infrastructure.
Ansible Automation Platform includes a visual dashboard, role-based access control (RBAC) and automation tools, including Red Hat Insights for Red Hat Ansible Automation Platform.
6 reasons to use Insights for Ansible Automation Platform
Formerly known as Automation Analytics, Insights for Ansible Automation Platform is designed to help teams better understand their automation usage across the organization, and establish common approaches and practices to automation workflows.
Here are some highlights on how you can use Insights for Ansible Automation Platform in your organization’s automation efforts.
1. Top Reports
Top Reports are built-in Insights reports that we’ve included based on customer feedback received over the years.
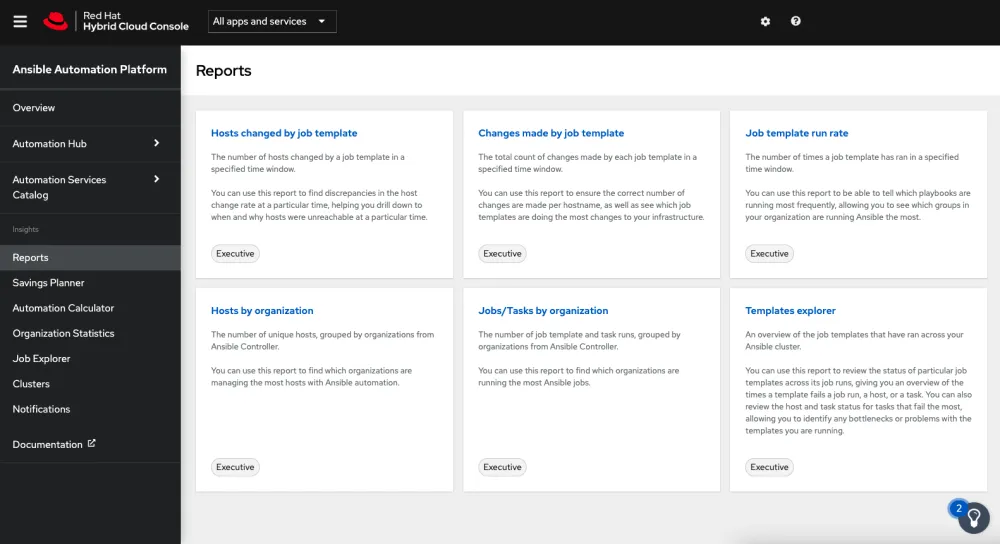
To start, this tool ships with six reports:
Hosts changed by job template
Changes made by job template
Job template run rate
Hosts by organization
Jobs/Tasks by organization
Templates explorer
And these are just the beginning—new reports will be added over time, based on ongoing feedback and as new features are built to support them.

Here’s a breakdown of a couple of the most recent reports we’ve added:
Hosts by organization and Jobs/Tasks by organization
These two reports show Ansible hosts, jobs and tasks usage broken down by organization. This information was previously captured in the Organization Statistics page, but we discovered that our users wanted to see trending lines on those graphs (as opposed to grouped bars), so we decided to migrate the visualizations to a set of reports.
Here’s an example of the Hosts by organization report that also shows some of the filtering capabilities you can use to drill down into subsections of the data.

Templates explorer report
Similar to our popular Job explorer page, the Templates explorer report gives you a birds-eye view on template usage across all Controller clusters. You can also drill down into status information for Jobs, Hosts, and Tasks, as well as identify potential bottlenecks and optimization opportunities in the “most failed tasks” breakdown chart.

PDF export of reports
If needed, you can export these six reports to PDF to share with users outside of the Ansible Automation Platform. This feature is accessible by an application programming interface (API) as well, so you’ll be able to schedule PDFs to be automatically generated and sent via email.
Here’s a quick demonstration of downloading a PDF version of the Hosts changed report.

2. Automation Savings Planner
Being able to clearly understand and communicate the potential and actual return on investment (ROI) of automation projects is a key factor in planning and decision making.
The Automation Savings Planner can help you plan and analyze the potential efficiency improvements and cost savings of your automation initiatives. The planner walks you through the process of developing a projection of how much time and money you could save by automating a specific IT task.

3. Automation Calculator
And after you’ve started to implement some of these plans, the Automation Calculator gives you perspective you need to quickly and easily understand and communicate how successful your automation initiatives actually are.
This tool is designed to help you quickly identify high ROI versus low ROI tasks so your team can make educated decisions about which types of automation tasks to focus on both now and in the future. Of course, since all organizations are unique, these tools and calculations are flexible and can be customized as needed.
We are planning a number of enhancements to the Automation Calculator to be released by the end of the year. These include a new look and feel, persistence of your cost settings, and PDF export similar to our other reports.

4. Advisor and Remediation
The Advisor service looks at your automation controller deployments and analyzes the collected metadata against a set of recommendations we’ve developed, based on our experience supporting Ansible and Red Hat Enterprise Linux (RHEL).
Advisor provides recommendations in four categories: availability, performance, stability and security. Each recommendation includes a description, a prioritized risk level, the number of systems impacted and whether the issue has an existing Ansible playbook.
When an Ansible playbook is available, the Remediation feature allows you to quickly generate and execute the playbook directly within the platform. Together, Advisor and Remediation help you cut down time wasted in identifying and troubleshooting issues across your systems.

5. Drift
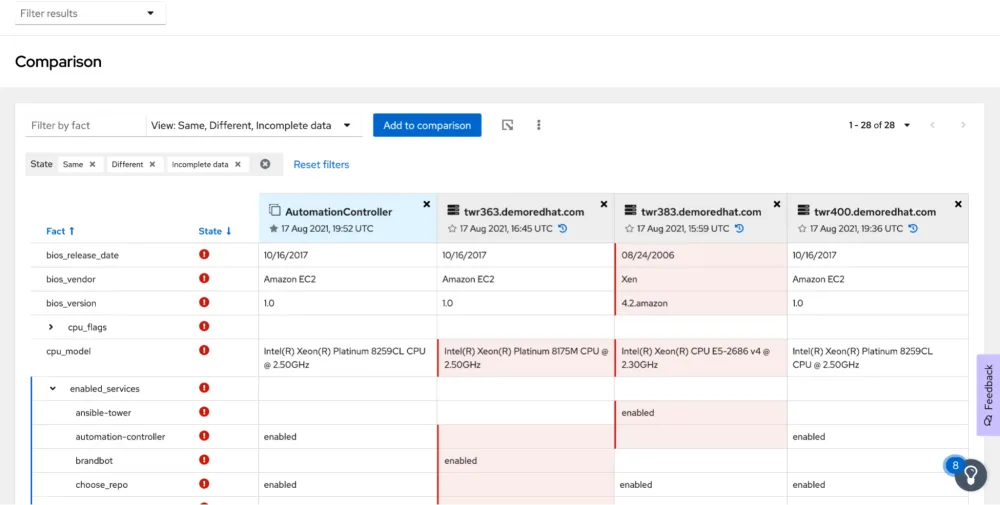
Drift lets you compare systems to identify differences either from a baseline you define, from other existing systems or from historical system profiles.
Creating and using a baseline for comparison gives you a quick and easy way to spot any deviations from a known-good state.
But you don’t have to use a baseline—you can simply compare one system to another and quickly spot any differences between them. This lets you make sure all members of a cluster are configured the same way, for example.
Finally, being able to compare current systems against historical profiles means it’s easy to identify differences from day to day. For example, if something was working on Friday but isn’t working on Monday, it’s easy to find and revert any changes.

6. Policies
The Policies tool lets you create custom rules to identify various platform components and trigger notifications and alerts when those rules are broken. Currently, notifications include sending emails to all subscribed users and all admins of the account, as well as triggering an HTTP POST request to integration endpoints.
For example, in a RHEL environment, you could use Policies to notify you if the firewall is turned off, or when a particular service is enabled or disabled.

Learn more
Ansible Automation Platform customers can enable Insights within console.redhat.com.
If you would like to learn more about the latest features in Red Hat Insights for Red Hat Ansible Automation Platform, watch this webinar: Gain Insights into your Ansible Automation Platform deployment.
As an added bonus, we’ve put together a short video series that gives you a quick and humorous way to explain the basics of automation to people you might be trying to convince to give it a try.
You can find that video series here: Automated Live! A video collection hosted by Colin McNaughton.
关于作者
Deb Richardson joined Red Hat in 2021 and is a Senior Content Strategist, primarily working on the Red Hat Blog.
