In this post:
-
Learn how to troubleshoot a resource usage spike utilizing the log entries displayed in the Web Console.
-
How the Web Console can show current real time performance information, historical graphs of performance metrics, and more.
-
Where you can get started with the RHEL Web Console today
If you’re a system administrator or in another position where you are responsible for Red Hat Enterprise Linux (RHEL) systems, you’ve probably been in this situation before: your customers or end users come to you saying the system is slow, and they need it fixed right away.
A common workflow is to check the system log files around the time the performance issue started to see what was occurring on the system at that time. In the past, this process involved manual steps that can be time consuming and challenging depending on your level of experience.
In RHEL 8.4, we introduced the ability for the Web Console to identify when resource usage spikes occurred (for example, a CPU spike). In RHEL 8.5 and RHEL 9 beta, we’ve extended this functionality to also show what was logged on the system around the time the spike occurred.
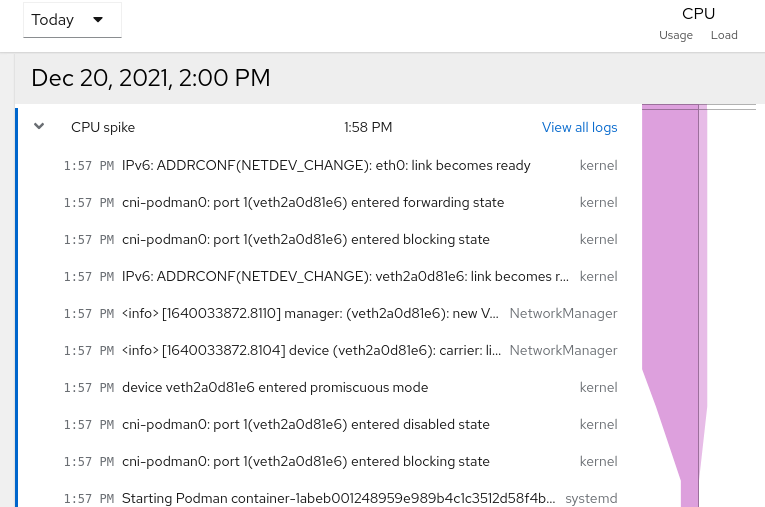
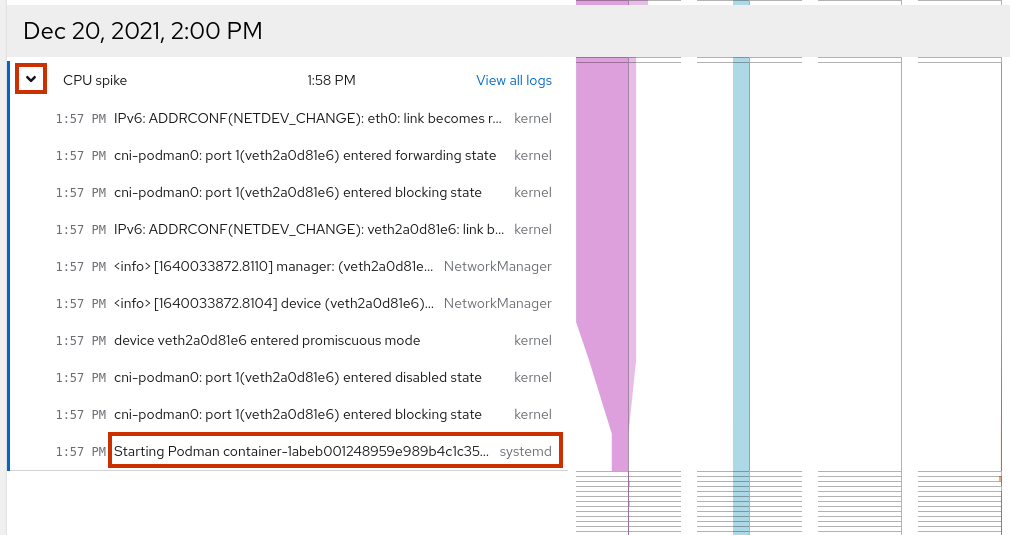
In this screenshot, the Web Console shows there was a CPU spike at 1:58 PM, and in addition, it shows log entries that occurred around this time. One of those log entries is related to systemd starting a Podman container (the bottom log entry in the screenshot).
This blog post will cover how to troubleshoot a resource usage spike utilizing the log entries displayed in the Web Console. In this example, I’ll determine that this Podman container is the cause of the performance issue, and will be able to resolve the CPU spike by stopping the Podman container.
Prerequisites
The first steps of getting started with the Web Console are ensuring that it is installed, enabled, and that the firewall allows the cockpit service. For more information on these steps, refer to the getting started using the RHEL Web Console documentation.
To access historical performance metric graphs in the Web Console, you’ll also need to have the cockpit-pcp package installed, and the pmlogger.service systemd service enabled/started. These steps can be done from the command line, or you’ll be prompted to complete these steps in the Web Console after you click the View details and history link under the Usage card on the Overview page.
In this blog post, I’ll also be using the Podman functionality within the Web Console. You can enable this functionality by installing the cockpit-podman package from the command line, or by going to the Applications section of the Web Console, and clicking on Install for the Podman application.
Investigating the performance issue
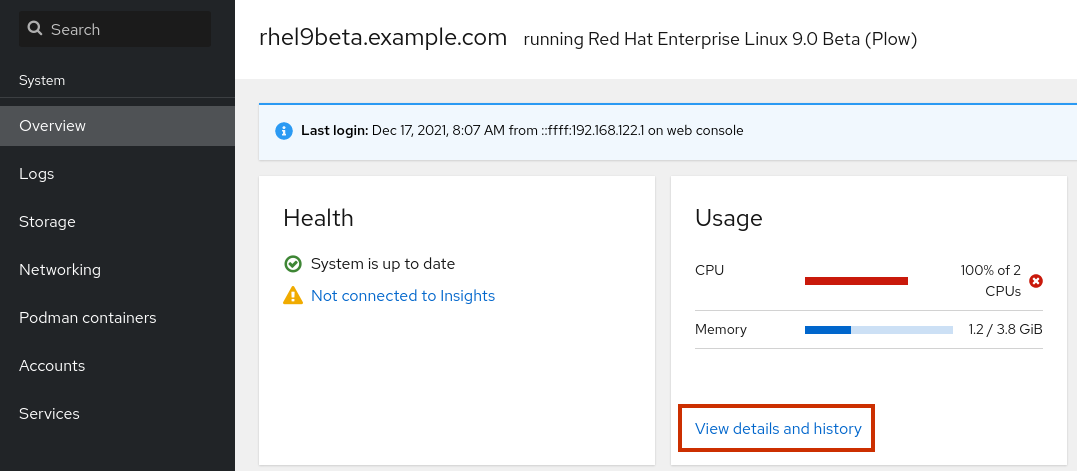
In this example scenario the system started running slowly about 30 minutes ago. To begin the investigation, I’ll log in to the Web Console, and from the Overview page, click View details and history under the Usage card.
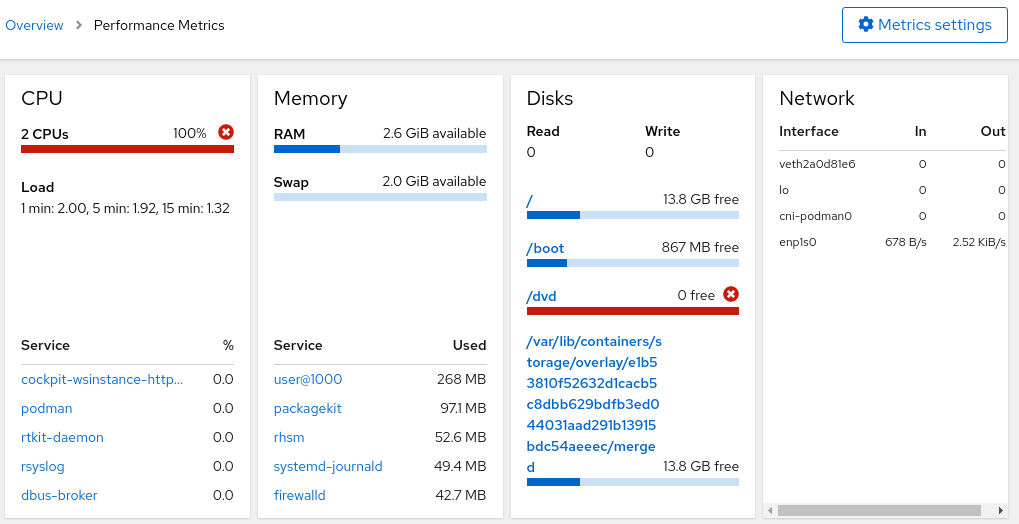
I’ll start by looking at the real-time performance metrics, which show how the system is doing at this very moment. I can immediately see that the system has two CPUs, and they are currently maxed out at 100%. The other metrics for RAM, swap, disk read/writes, and network traffic, however, currently look good.
Next, I’ll scroll down and look at the historical performance graphs, and I can see that around 30 minutes ago, there was a CPU spike recorded at 1:58 PM.
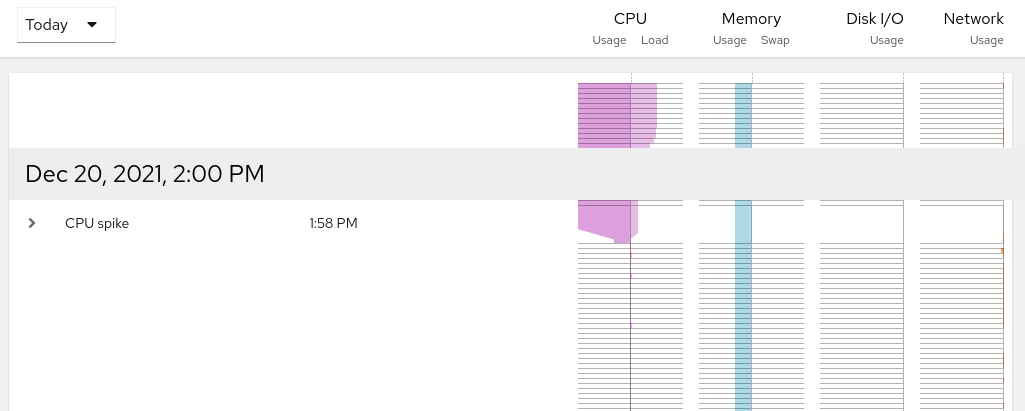
If I click the arrow next to the CPU spike, I can see the log entries that occurred around this time. Each of these lines is a link that can be clicked on to show additional information. The log entry that looks most interesting to me is the bottom one that shows that systemd started a Podman container at 1:57 PM. If I click that log entry line, I’ll see additional details.
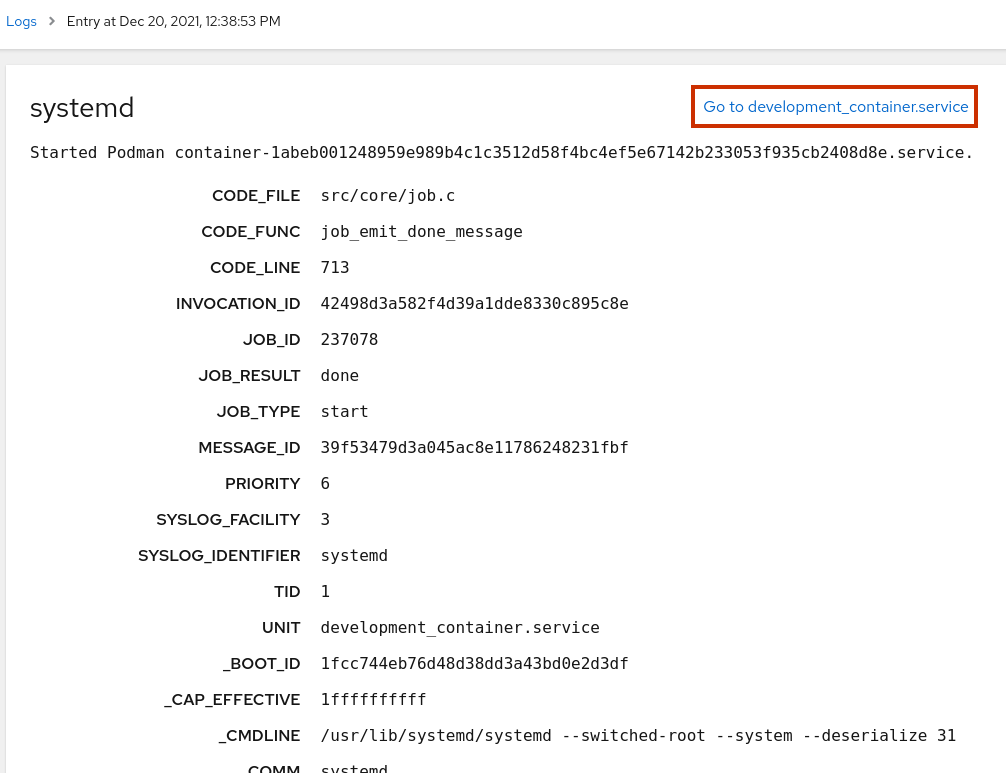
On the log entry page, I can see the details of this log entry. In the top right, I’ll click the link to see details about the systemd service that started the container, development_container.service.
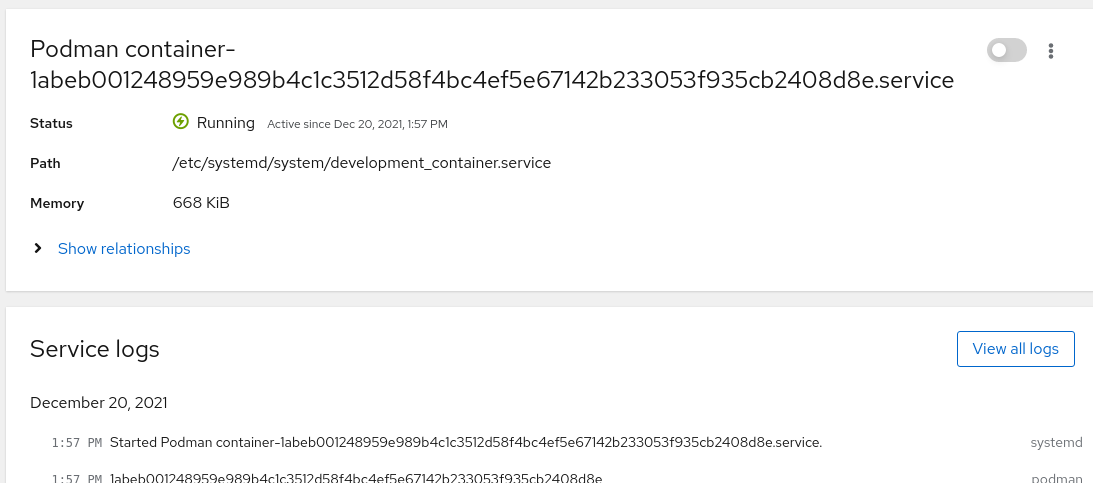
From the development_container.service page, I could click on the dots in the upper right corner and stop the systemd service for the container; however, I would like to do some more investigating first.
This system has the cockpit-podman package installed, which allows me to manage Podman containers from the Web Console.
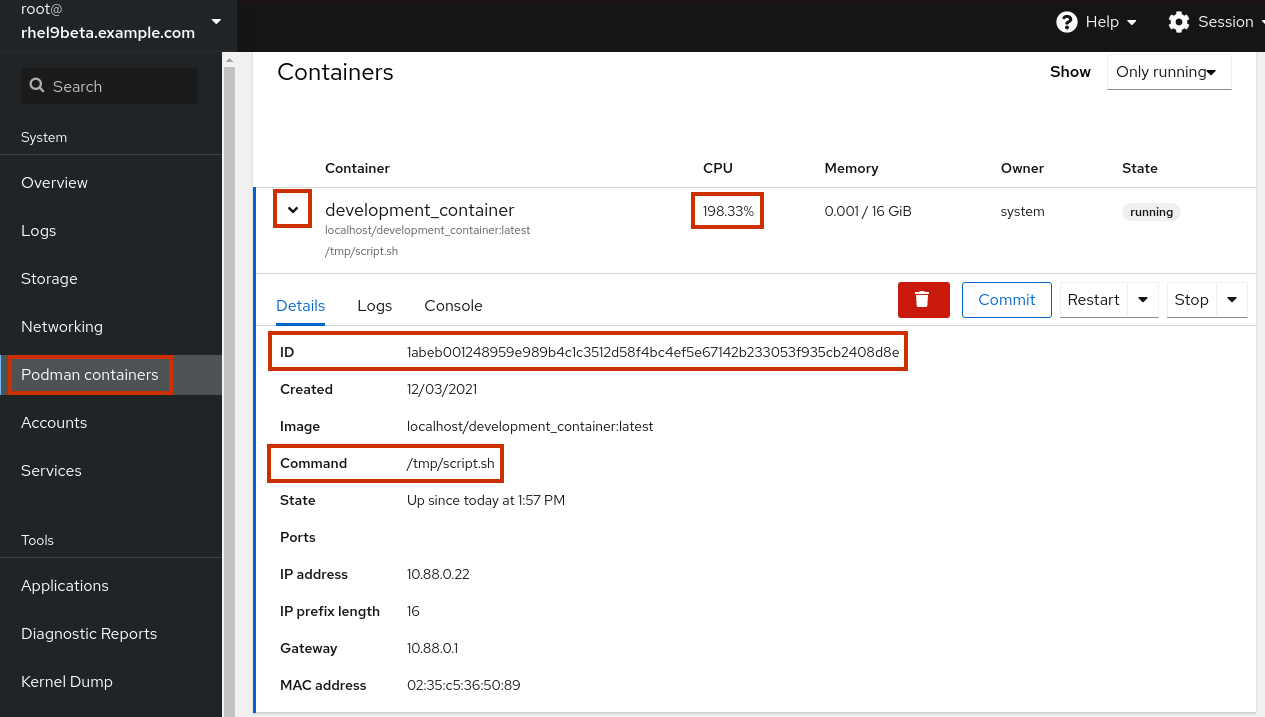
I’ll start by clicking on Podman containers in the menu on the left. I’ll then see a list of running containers, and after clicking on the drop-down arrow on a container I’ll see additional details about the container.
I’ll verify this is the same container that was originally shown in the log entry for the CPU spike by verifying that the container ID shown on this page matches the container ID in the log entry, which it does. In addition, I can see the command that was started in the container, which in this example is /tmp/script.sh, and I can see that the container is consuming 198.33% of CPU (almost all of the 2 CPU’s on the system).
From here, I could optionally click on the Console tab and run commands within the container to gather additional information.
At this point, I would like to stop this container on the system. This container was started by a systemd service, so if it is stopped from the Podman section of the Web Console, systemd will automatically restart it again.
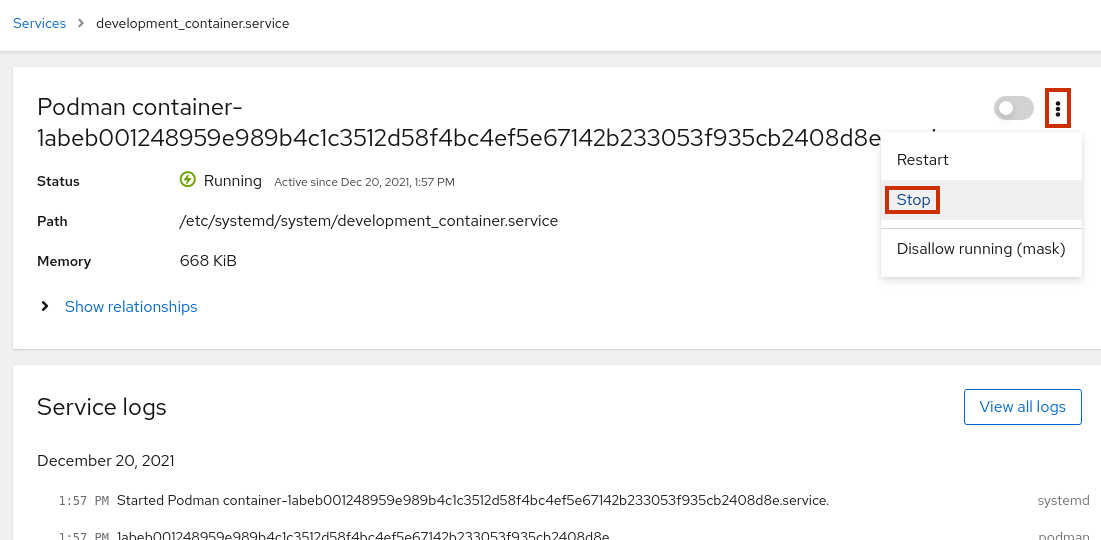
To stop a container started from a systemd service, I’ll need to go back to the development_container.service systemd service in the Services section of the Web Console. From there, I can click on the dots in the upper right corner, and click Stop, as shown:
After the service stops, I’ll go back to the Overview section of the Web Console to verify CPU usage looks better. With the development_container.service stopped, the CPU usage has gone down to 5%.

Conclusion
The Web Console is a great place to start troubleshooting a potential performance issue on a RHEL system. The Web Console can show current real-time performance information and historical graphs of performance metrics. In addition, it can identify resource usage spikes and show log entries that occurred around the time of these usage spikes.
Get started today with the RHEL Web Console by following the getting started using the RHEL Web Console documentation.
关于作者

Brian Smith is a product manager at Red Hat focused on RHEL automation and management. He has been at Red Hat since 2018, previously working with public sector customers as a technical account manager (TAM).


