Overview
The policy framework in Red Hat Advanced Cluster Management for Kubernetes (RHACM) is designed to help you to determine what clusters each policy is distributed to, and see what the current compliance status is on each cluster. In addition, the framework stores a limited amount of compliance history for each distributed policy, allowing you to see when the compliance may have changed. However, the limited amount of history and the format of the data can make it difficult to view compliance trends and compare them across multiple policies.
In the 2.4 release of RHACM, the framework supports the new metric, policy_governance_info on the hub cluster which is used as an additional way to record compliance and distribution information. This new metric is collected by the default OpenShift monitoring stack, which exposes Prometheus queries to view the data.
In this blog we discuss the capabilities of this new metric, and show example queries to demonstrate its usefulness.
Metric overview
When a user creates a policy in the framework, they are creating a root policy. The framework watches for root policies, as well as PlacementRules and PlacementBindings, to determine where to create propagated policies in order to distribute the policy to managed clusters. For each active policy, both root and propagated, the framework reports a metric of 0 if the policy is compliant, and 1 if it is noncompliant. The metric uses the following labels:
type: The values for this label can be eitherrootorpropagated.policy: The name of the associatedrootpolicy.policy_namespace: The namespace on the hub cluster where therootpolicy was defined.cluster_namespace: The namespace for the cluster where the policy is distributed.
These labels and values are simple, but they enable queries that can show many things happening in the cluster that are otherwise difficult to track.
Note that if the metrics are not needed, or there are any concerns about performance or security, this feature can be turned off. Just set the DISABLE_REPORT_METRICS environment variable to true in the propagator deployment.
Visualizing New Policies
Let's imagine a situation where there are many new policies added over a period of time. Not all of the clusters in the fleet are compliant with every new policy; the goal is to have a picture of the cluster compliance over time. In particular, let's see how the total number of distributed policies have changed, compared to how many non-compliant policies are present.
Since the metric is 1 when the policy is non-compliant, let's compare with == 1 in the query to restrict the count to just the non-compliant policies. With that in mind, these queries compare the non-compliant policies with the total number of policies, over time.
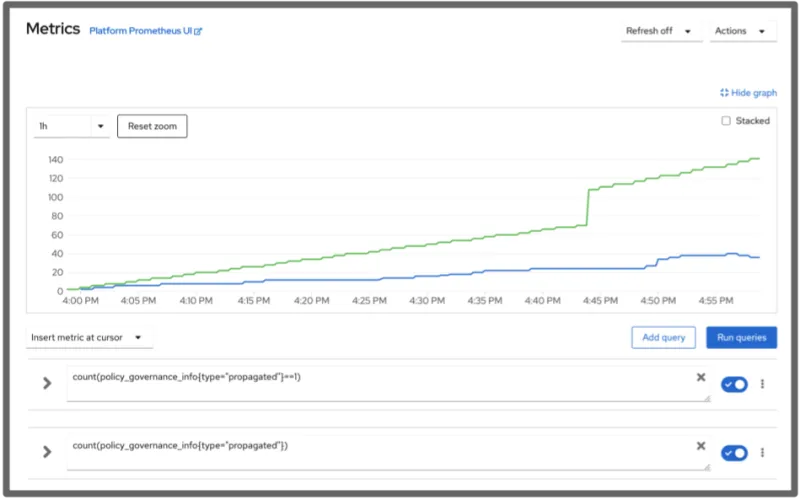
count(policy_governance_info{type="propagated"} == 1)count(policy_governance_info{type="propagated"})
In a fleet where this is simulated, you might receive the following plot:

Notice that the number of policies regularly increased over time due to our example simulation. However, there is a sudden spike in policies around 4:45pm on the graph. What happened there? In our simulation, we added a new cluster to the fleet at that time, and existing policies were suddenly distributed to it.
Some of this information can be inferred from other data provided by the governance policy framework. However, to observe the spike without these metrics, it is required to look through all of the policies and examine many timestamps. This is tedious, to say the least, but with this graph it is very straightforward.
Watching a Specific Cluster
The previous plot displays a view of all the distributed policies in the fleet. It might be beneficial to watch a specific cluster more closely. For example, let's monitor a high-priority production cluster that must be completely compliant. The metric label cluster_namespace supports filtering the view, similar to the following queries:
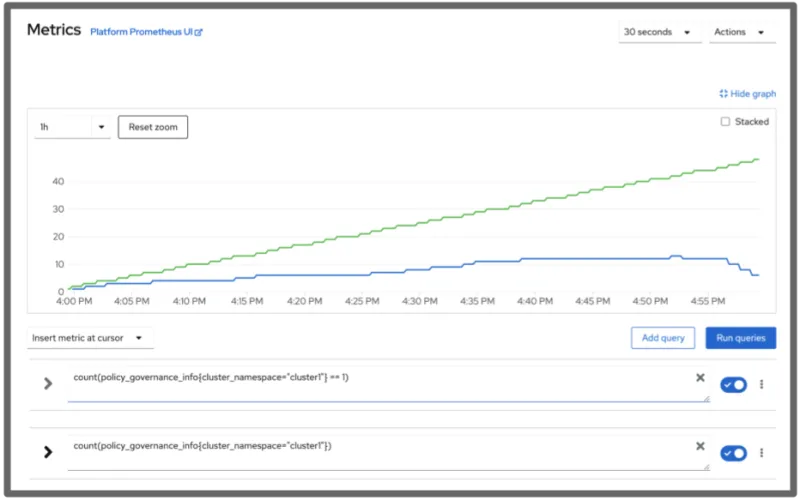
count(policy_governance_info{cluster_namespace="cluster1"} == 1)count(policy_governance_info{cluster_namespace="cluster1"})
Applying this to the simulated fleet, the following plot is displayed:

Since the queries are limited to one cluster, the spike in policies as a result from the cluster being added is not displayed. You can also observe more easily that some of the policies were remediated near the end. In this simulation, the policies were manually remediated, but it is also possible to resolve them through other integrations like Ansible playbooks. Again, this information is available in other ways using the framework, but it is more tedious to compile it into one picture as mentioned.
Policy Trends
Let's simulate something more complicated: a situation where two policies are somehow interfering with each other.
Maybe to remediate one policy, an administrator is taking an action that causes another policy to become non-compliant. Then, an automated process might "fix" the newly non-compliant policy in a way that reverts the administrator's change. The administrator might notice this situation and guess that the two policies are interfering, but how can they confirm this?
The following queries count the compliance of two policies and put them on one plot:
count(policy_governance_info{type="root",policy="mypolicy-1"} == 0)count(policy_governance_info{type="root",policy="mypolicy-2"} == 0)

In this case it becomes clear that the policies are never both compliant, which indicates that there is a strong correlation between the queries. In other cases, a plot like this can help observe that a policy is always non-compliant at a certain time of day, or a specific day of the week. These trends can point to any further investigation in the right direction.
Conclusion
The policy_governance_info metric from the policy framework (added in RHACM 2.4) provides a new way to view policy compliance and distribution in a fleet of clusters. The data that it provides can be used to examine compliance trends in a way that was not previously possible. By enabling queries to filter by cluster, policy, and compliance, questions that users have about the cluster compliance can be answered more quickly than ever. For more information about the policy_governance_info, see Governance metric from the product documentation. We hope that this blog is helpful and enables users to view a multitude of things happening in their clusters.
