
OpenShift 4 has always shipped with a set of metrics-based dashboards meant to provide insight and help troubleshoot common cluster problems. In 4.3, we’ve taken the step to build these dashboards directly into the console rather than relying on external tools. Native metrics dashboards are part of a series of steps we’re taking towards a better troubleshooting experience in OpenShift.

Metrics Dashboards
You can find the new dashboards under the Monitoring navigation section. Once you’re viewing a dashboard, you can use the Dashboard dropdown selector to choose a different dashboard type.
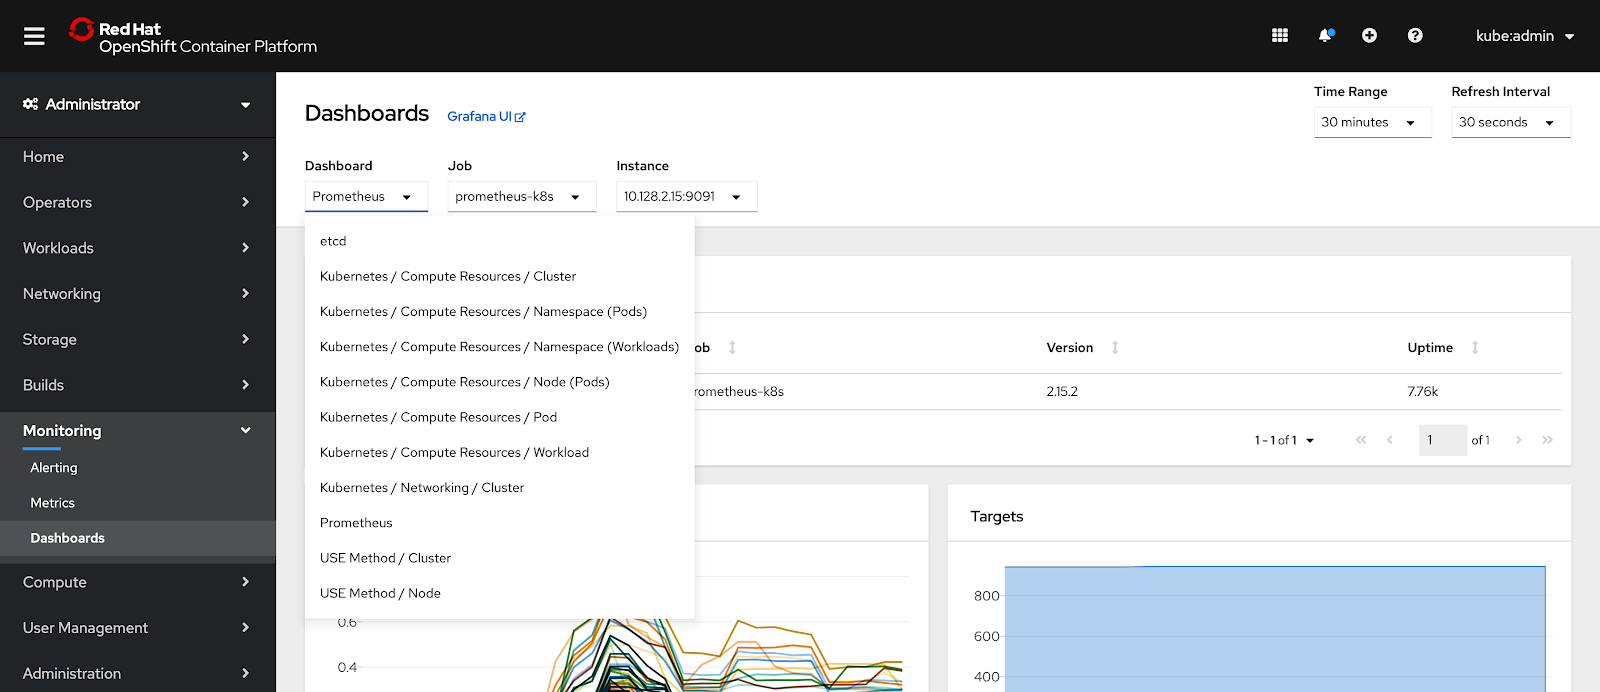
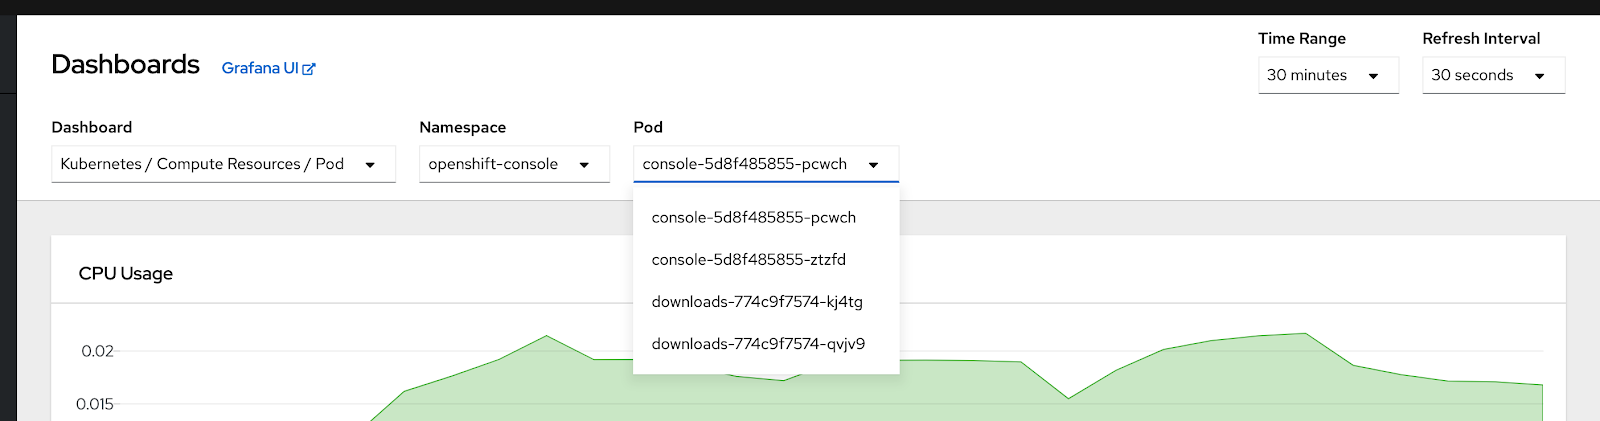
Currently, these types include resource usage overviews for different kinds of objects as well as pre-configured USE method dashboards. Certain dashboard types will provide more dropdowns for other variables, such as which namespace and pod to display metrics for.
More and Better
Bringing the metrics dashboards into the console enables us to provide more robust connections between different pieces of console data. As we continue to develop these connections, we hope to make it simple to track a problem across alerts, metrics, logs, and objects; reducing time to resolution and making life easier. You may also see more types of dashboards appear in the list of options as new features and operators provide metrics to the console. Do you have ideas for improving your troubleshooting workflows in OpenShift? Have you noticed things you would like us to add to the new metrics dashboards? Share your thoughts here and help us make OpenShift a better problem solving tool.


