Guest Blog By Jeff McCormick (Crunchy Data)
Crunchy Data, a member of the CNCF and an active collaborator in the OpenShift Commons, discusses in this blog how PostgreSQL metrics are collected and stored as part of the Crunchy Containers project with Prometheus on OpenShift, Red Hat’s container platform that combines and optimizes the power of Docker containers and the Kubernetes container cluster manager for enterprise app development and deployment.
Crunchy is pleased that the Prometheus project has released Prometheus 1.0 which is now deployed in the 1.2.2 version of the crunchy-prometheus container described in this blog.
The Crunchy containers are open source and are found within this Github repository https://github.com/crunchydata/crunchy-containers
The central concern of the Crunchy Containers started with providing a solid open source set of PostgreSQL database containers, but we quickly found that customers would also want a means of monitoring their provisioned PostgreSQL database containers. PostgreSQL has unique metrics which allows a DBA to gain insight into the health of their databases.
For this purpose, Crunchy developed the following containers:
- crunchy-collect - collects 32 different PostgreSQL metrics from a database container
- crunchy-grafana - provides a web based graphing dashboard for collected PostgreSQL metrics, Grafana connects to a Prometheus data source to query metrics
- crunchy-prometheus - contains Prometheus 1.0 for metrics collection
- crunchy-promgateway - contains a Prometheus Push Gateway
These containers are pre-built and can be found on DockerHub at the following location https://hub.docker.com/u/crunchydata/
Collecting Metrics
The crunchy-collect container can be placed within a database pod to begin metrics collection. An example of a pod that includes the crunchy-collect container is here. In Figure 1, metrics are collected and pushed to the Prometheus Push Gateway where they will be scraped on a scheduled basis by the Prometheus server.
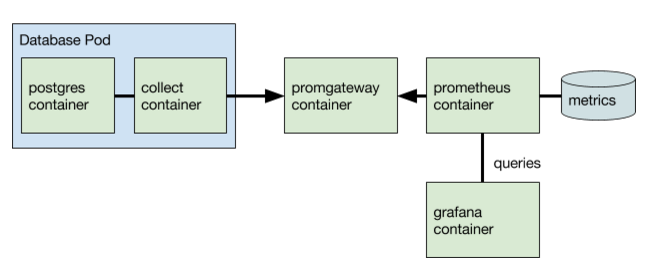
Figure 1 - Metrics Collection
The Prometheus server is configured to treat the Prometheus Push Gateway as a Target on a 15 second interval. The Prometheus configuration file is found in the following location:
https://github.com/CrunchyData/crunchy-containers/blob/master/conf/prom…
Prometheus provides a web console where you can query the metrics directly as shown in Figure 2.

Figure 2 - Prometheus Web Console Showing PostgreSQL Metric
The Prometheus Push Gateway also has a web console that shows the collected metrics ready to be scraped by the Prometheus server.
A sample screenshot of the Prometheus Push Gateway web console is shown in Figure 3.

Figure 3 - Prometheus Push Gateway Web Console Showing PostgreSQL Metrics
The grafana graphing product is included in the crunchy-grafana container. Grafana lets you specify the Prometheus server as a data source. Its main feature is to let the user define custom graphs which use the Prometheus data source as the source for metrics. The Grafana web console is shown in Figure 4.

Figure 4: Grafana Dashboard
PostgreSQL Metrics
Currently, the crunchy-collect container collects roughly 30 different types of PostgreSQL metrics from a running database container, a sample of the metrics is shown in the following table:
| Metric Name | Purpose |
| crunchy_connections | The number of active connections |
| crunchy_databasesize | The size in Megabytes of a database |
| crunchy_tup_fetched | Count of tuples selected |
| crunchy_tup_inserted | Count of tuples inserted |
| crunchy_connectionutil | The pct utilization of max connections |
| crunchy_temp_files | Number of temp files |
About Crunchy Data
Crunchy Data is a member of Red Hat Technology Connect, OpenShift Primed Partner, a contributor to OpenShift Open Source project, and an active collaborator in the OpenShift Commons.
Crunchy Data is a leading provider of trusted open source PostgreSQL and PostgreSQL support, technology and training. Crunchy Data is the provider of Crunchy Certified PostgreSQL, an open source PostgreSQL 9.5 distribution including popular extensions such as PostGIS and enhanced audit logging capability. Crunchy Certified PostgreSQL is currently the only open source database Common Criteria certified at the EAL2+ level.
When combined with Crunchy’s Secure Enterprise Support, Crunchy Certified PostgreSQL provides enterprises with an open source and trusted relational database management solution backed by enterprise support from leading experts in PostgreSQL technology. For enterprises requiring dedicated PostgreSQL support, Crunchy provides on-premise PostgreSQL professional services and PostgreSQL training. Learn more at www.crunchydata.com


