Traditional network observability methods rely heavily on analytics and dashboards, and require users to manually sift through extensive data to derive actionable insights.
Additionally, the telemetry data used in most of the network monitoring solutions is one-dimensional and isn't granular enough to deterministically identify the root cause of service degradation. Monitoring solutions are either based on performance metrics data for application monitoring or resource utilization data for infrastructure monitoring. Additionally, policy configuration (security and quality of service (QoS) policies) for the deployed workloads is not taken into consideration.
The combination of limitations in method and limitations in telemetry data poses significant observability challenges in large-scale clusters with strict service level agreements (SLAs), where rapid decision-making is paramount to maintaining a high level of service quality. The current observability solutions and workflows consist of manual steps for root cause analysis which is cost and time intensive, relies on reactive procedures, often requires multiple iterations and requires a high level of domain knowledge and expertise.
This article explores the use of machine learning (ML) to address the challenges in achieving automated and deterministic root cause analysis. This approach can reduce the cost of root cause analysis and enable proactive mitigation so that service providers can maintain high levels of service quality with minimal SLA violations.
Analyzing complexity for shared virtualized environments

To appreciate the scale of the challenge in network observability for OpenStack, let's look at the variables involved. The data path can be a kernel data path or a fast data path (SR-IOV, OVS-DPDK). From a routing perspective, there are two options–centralized routing going through the networker node / gateway device or distributed path directly via top of rack switch/router (ToR). Localizing at the node level in a cluster consisting of 100s or 1000s of nodes is the first challenge.
In some scenarios the root cause may be on the control plane scale or performance level. Often service providers address this by over-provisioning capacity, but this approach is not suitable or preferable in all the deployment scenarios.

In a typical OpenStack deployment, the metrics collection and visibility across Open Virtual Network database (OVN DB), interface or port level stats for Open Virtual Switch (OVS)/OVN, data plane development kit (DPDK) poll mode driver (PMD) stats, and system metrics and resource utilization stats all add to the complexity and scale of the problem in identifying the root cause for performance degradation or service unavailability.
Contention for resources may be at the network interface card (NIC), OVS or network function level. While network configuration and resource allocation may be appropriate for the desired service level at deployment time, the variability in workloads and the network traffic generated by the deployed workloads makes the resource contention visible in terms of service degradation. For continuous operation with Day 2 operations and beyond, automated observability becomes essential.
For instance, shared CPU cores or memory allocated for system or kernel processes may initially suffice, but workload fluctuations can strain those resources. Similarly, the isolation of workload performance, along with monitoring buffer sizes and queue lengths for packet forwarding, requires observability mechanisms that can trigger automated remediation actions. This proactive approach helps prevent service degradation and minimizes the need for reactive, manual interventions.
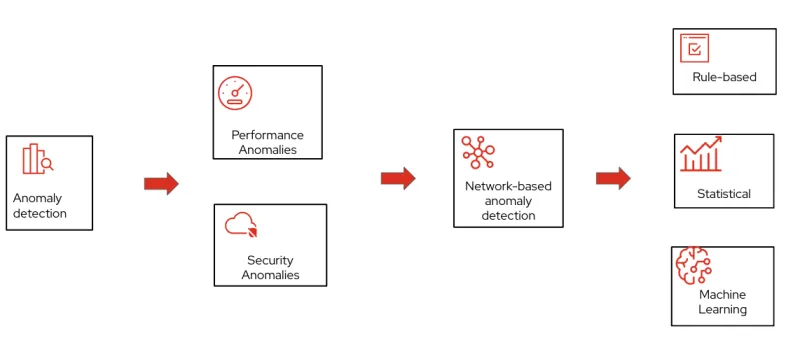
Anomaly detection

Rule based detection methods rely on established patterns, signatures or thresholds. The primary challenge for rule based methods is the development and implementation of patterns and signatures. This process is complex and extremely difficult to scale.
Statistical methods rely on establishing a normal behavior for the system and then identifying any data outside normal definition as an anomaly. The challenge here is to establish the definition of "normal" as the networks are very diverse in terms of protocols, applications, scale and usage time. Additionally, convergence time is high for accurately detecting anomalies.
Machine learning (ML) approaches address these limitations by pre-training models, allowing them to scale across large sets of metrics and nodes. ML also enables the correlation of vast amounts of data, providing superior root cause analysis and earlier detection of anomalies—often before service degradation thresholds are reached.

Machine learning to the rescue
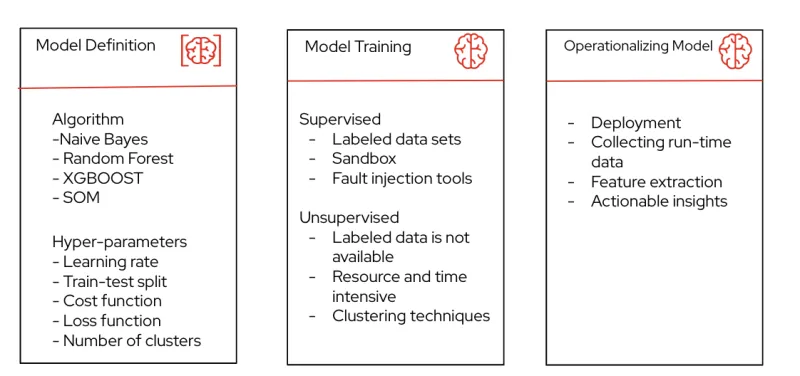
Two key components for model definition are the ML algorithm and the hyperparameters. Some key algorithms that have shown high accuracy for both regression and classification are random forest, XGBoost and self-organizing maps.
Random forest: A parallel ensemble of decision trees, where the average output across trees helps prevent overfitting. This method is easy to parallelize, handles large datasets efficiently, offers high accuracy and can be applied to both regression and classification tasks.
XGBoost: A highly efficient implementation of Gradient Boosted Decision Trees (GBDT). It utilizes a sequence of shallow trees, with each iteration refining the model by reducing errors and improving accuracy. This iterative approach makes XGBoost highly performant for complex datasets.
Self-organizing maps (SOM): An unsupervised machine learning technique that relies on clustering methods to organize and represent data. SOMs are useful for pattern recognition and data visualization without the need for labeled data.
Hyperpameters are the other key component for the ML model that control the learning process and the parameters that result from the model training. Some of the common hyperparameters in use are as follows:
- Learning rate: How quickly a model converges during training
- Train-test split: How the data set is split for train and test phases of the training
- Cost/loss function: Measure the delta between the predicted and actual value for the model do that error can be minimized over subsequent iterations
- Number of clusters: Number of clusters used for unsupervised training
The hyperparameters impact the convergence time and accuracy of the output from the ML model and there are well-established methods for tuning these or making the trade-off to achieve the desired results.
Hyperparameters impact an ML model's convergence time and output accuracy, and there are well-established methods for tuning these or making appropriate trade-offs to achieve the desired results.
Evaluation of a ML model can be based on three broad metrics:
- Accuracy: Percentage of accurate predictions
- Precision: Measure of true positives and gives an idea on the percentage of false alarms
- Recall: How many times a positive outcome is not identified or missed
Model training
Model training can be divided into "supervised" and "unsupervised" learning processes.
One of the key purposes of unsupervised learning models is to deal with a lack of labeled datasets. While detecting novel anomalies is a benefit of unsupervised learning, it comes at the expense of a high level of false alarms.
Supervised ML models, on the other hand, require labeled datasets. Labeled datasets for network function workloads are difficult to create because of the enormous number of metrics and variables at play. Labeled datasets may be created using pre-training in a lab environment. This requires a sandbox that can mimic the workload usage patterns and infrastructure resource footprint, and has tools for fault injection such as CPU stress, network stress, memory stress or contention with oversubscription of forwarding buffers and queues.

One of the key building blocks for pre-training of datasets is data collection using standardized or well established frameworks such as OpenTelemetry, model selection, model evaluation and hyperparameter tuning.
Operationalizing models
Operationalizing a model includes deployment, data collection, feature extraction and anomaly mitigation.

The pre-trained model can then be deployed in the production network in a closed loop configuration integrated with anomaly mitigation tools that can optimize the configuration and resource allocation for virtual workloads based on the fault localization and anomaly information generated by the ML models.
Achieving closed loop automation and implementing automated anomaly mitigation is highly dependent on the quality and accuracy of the outcome or actionable intelligence generated by the ML models. Improving quality, accuracy and predictability relies on level of experience and adoption of ML methods in production environments. The first phase may include manual mitigation based on the outcome of the ML-based anomaly detection methods. The second phase of automated mitigation will require network operation teams to develop the confidence on accuracy, quality and interpretability of the outcomes generated by these models.
Future work
Developing sandbox capabilities to simulate production environments and tools to generate synthetic datasets that mimic real world scenarios in non-production environments will help with market adoption of ML-based models for enhanced and automated network observability.
This requires several key components to be fully matured and feature-complete. While some research and open source tools are available, additional development is ongoing. Areas requiring further progress include adopting and integrating OpenTelemetry-based frameworks, developing open source tools to simulate resource and workload footprints in virtual environments, and creating fault injection tools and testing virtual network functions (VNFs) that facilitate VNF-centric telemetry data collection.
Learn more
关于作者
Experienced Product Manager renowned for driving innovation in network and cloud technologies. Expertise in strategic planning, competitive analysis, and product development. Skilled leader fostering customer success and shaping transformative strategies for progressive organizations committed to excellence
Highly engaged in the pioneering stages of ETSI NFV standards and OPNFV initiatives, specializing in active monitoring and ensuring reliability in virtualized network deployments
