
This article demonstrates how to use the Prometheus/Thanos API to collect metrics and monitor through Zabbix. It will use the Low Level Discovery feature to create items and triggers.
This article uses the following versions:
- OpenShift v4.13.1
- Zabbix 6.4.6
Installation of the Zabbix will not be covered.
About
This article is aimed at users who need to create and monitor an OpenShift cluster with Zabbix using capacity alerts, applications, etc.
I will use Zabbix to connect to the Prometheus/Thanos API and have access to all metrics available in the environment, including etcd, pods, containers, infrastructure, and custom applications.
I will create a template using the LLD (Low Level Discovery) resource, which will process the collection of metrics that I define and create the items and triggers.
Prerequisites:
- User with the cluster-admin cluster role
- OpenShift 4.12 or +
- Zabbix Server
Creating a ServiceAccount in OpenShift
In OpenShift, create a ServiceAccount to use in the Zabbix connection to Prometheus/Thanos.
Using the oc CLI, connect to OpenShift and follow the steps below:
$ oc project openshift-monitoring
$ oc create sa zabbix-sa
$ oc adm policy add-cluster-role-to-user cluster-monitoring-view -z zabbix-sa
Collect the zabbix-sa serviceaccount token:
$ SECRET=`oc -n openshift-monitoring describe sa zabbix-sa | awk '/Tokens/{ print $2 }'`
$ oc -n openshift-monitoring get secret $SECRET --template='{{ .data.token | base64decode }}'
Collect the Thanos endpoint:
$ oc get route thanos-querier -n openshift-monitoring -o jsonpath='{.spec.host}'
Create host group
Create a host group to organize OpenShift hosts to monitor.
To do this, in the left side menu, click on Data collection > Host groups > Create host group > Define the Group name, and click Add.

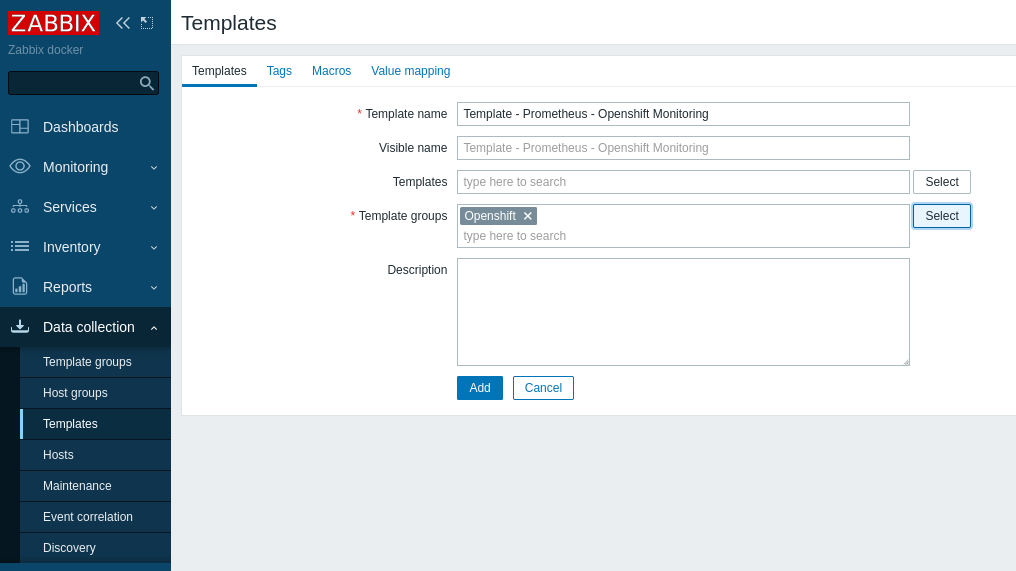
Create a template
Next, create a template to reuse the monitoring on other hosts.
In the left side menu, click Data collection > Templates > Create template > Define the Template name > In Template groups, enter the name you want, and click on the new option that will appear. Click on Add.
Create an item
Create the first item. In it, define the Prometheus/Thanos endpoint, token for authentication, and metric to create the first LLD.
In the left side menu, click Data collection > Templates > Select the template created previously > Click on Items at the top, then click Create item.
Create an item that will query the state of all ClusterOperators.
| Field | Value | Description |
| Name | Get ClusterOperators | Define a name that facilitates what this data collection refers to |
| Type | HTTP agent | This is a collection using API via http request |
| Key | prom.get.operators | Define a unique identifier |
| Type of information | Text | Text type due to the amount of information that will be collected |
| URL | {$PROMETHEUS_OCP} /api/v1/query | Add a Macro (variable) that will receive the Prometheus or Thanos endpoint |
| Query fields | query = cluster_operator_up{name=~".*"} | Define it as a query and the value will receive the promql query to use in the collection |
| Request type | GET | Type GET because it is a collection query |
| Request body type | Raw data | Process data in next step |
| Headers | Authorization = {$TOKEN} | Use authentication with bearer token, add Authorization, which will receive a macro called token |
| Update interval | 1m | Set the collection interval as needed |
| History storage period | 1h | Set the Storage period as needed |

After filling in the suggested fields, click on the Preprocessing tab and click Add.
- JSONPath:
- Set JSONPath in Name
- In Parameter add the following: $.data.result[*]
- JavaScript:
- Set JavaScript in Name
- In Parameter add this block:
  output = JSON.parse(value).map(function(js){
      return {
          "operator": js.metric.name,
          "state": js.value[1]
      }})
  return JSON.stringify({"data": output})
This script filters the entire output of the collection and displays only the operator name and state.
To validate that the Preprocessing is working correctly, click Test all steps.
Check the Get value from the host box, add the Macros values, add the Thanos or Prometheus endpoint and the bearer token, then click Get value and test.
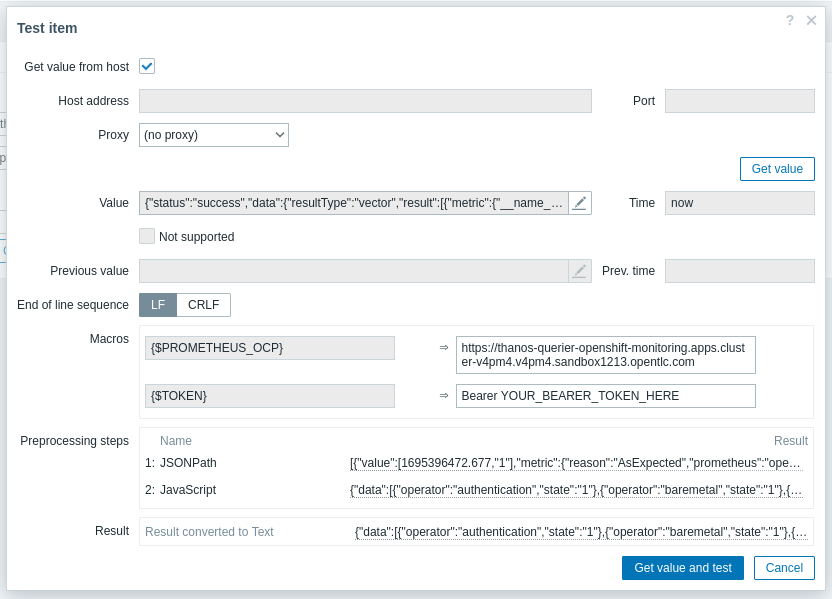
In Result, validate the processed output using the data selected in the JavaScript.
After completing the necessary tests, close the test window and click Update to save the Item.

Create Discovery rules
Next, create a Discovery, which will process the data collected by the Item created in the last step and dynamically create the items and triggers.
Still within the Template, click on Discovery rules > Create discovery rule.
| Field | Value | Description |
| Name | LLD Cluster Operator UP | Define a name that facilitates what this LLD refers to |
| Type | Dependent item | LLD depends on collecting the previously created Item |
| Key | lld.get.co | Define a unique identifier |
| Master item | Item name | Select the Item created earlier, it will provide the data to be processed |
| Keep lost resources period | 1d | Set the desired time |
Now click on LLD macros. Add two macros to receive the operator and state data defined in the JavaScript.
Click Add, create the two macros listed below, and select Update:
{#OPERATOR} => $.operator
{#STATE} => $.state

After clicking Update, click Item prototypes, and then Create item prototype.

Now, create the Item Prototype. It's a template for dynamic item creation. Fill in the fields below:
| Field | Value | Description |
| Name | Cluster Operator ($OPERATOR) Status | Use Macros to customize the created item |
| Type | Dependent item | LLD depends on collecting the previously created item |
| Key | lld.co.get.sts[{#OPERATOR}] | Define a new unique key and enter the OPERATOR macro, which will be used as a query parameter |
| Type of information | Numeric (unsigned) | Define it as Numeric, as it will only display the state value, which receives numeric data |
| Master item | Item name | Select the Item created earlier, it will provide the data to be processed |

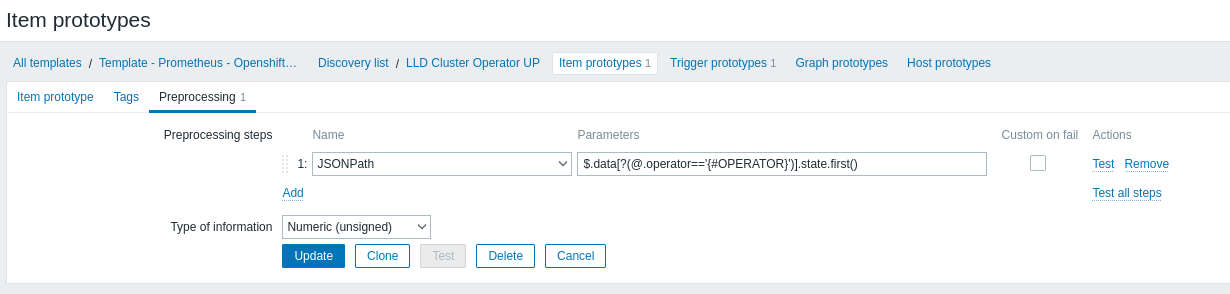
Click on Preprocessing and then Add. Add the following preprocessing step and click Update.
JSONPath => $.data[?(@.operator=='{#OPERATOR}')].state.first()
This parameter filters the output, informing it that the operator will be equal to the value of the OPERATOR macro and, for this operator, only display the state value.
Now click on Trigger prototype. Create an alert for when there is a degraded operator.
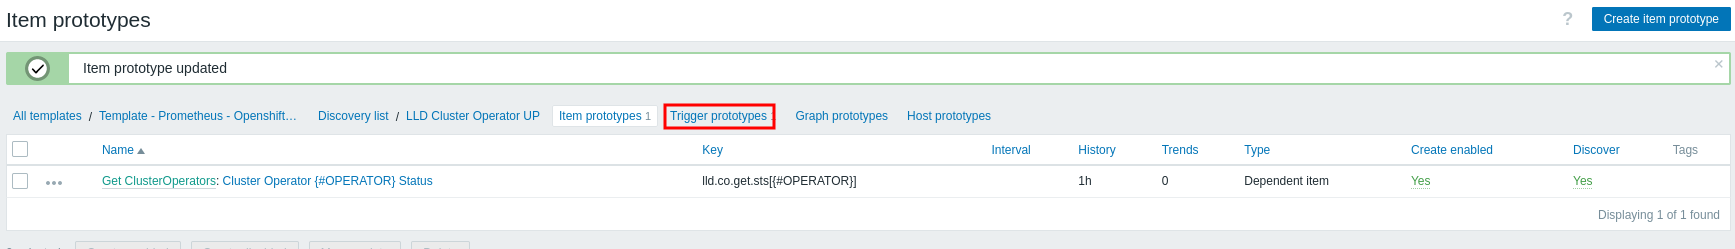
Click on Create trigger prototype and fill in the data below:
| Field | Value | Description |
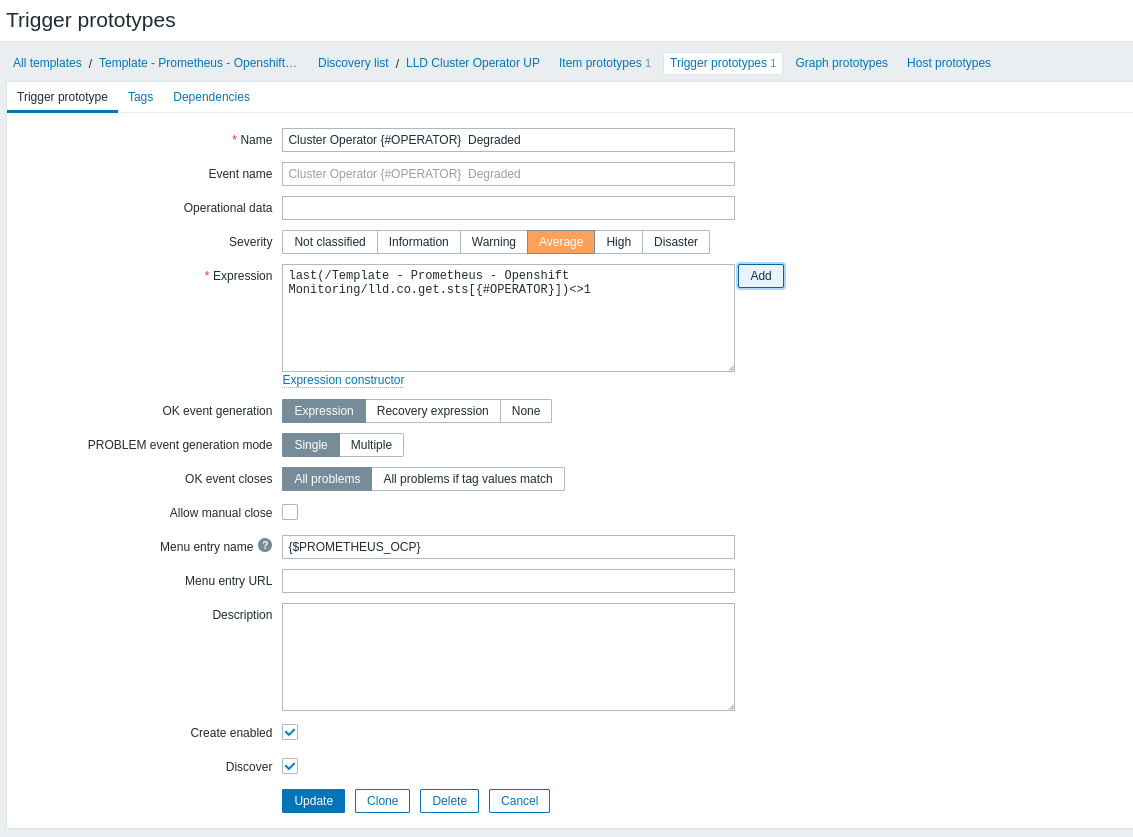
| Name | Cluster Operator {#OPERATOR} Degraded | Use Macros to customize the created trigger |
| Severity | Average | Set the desired severity |
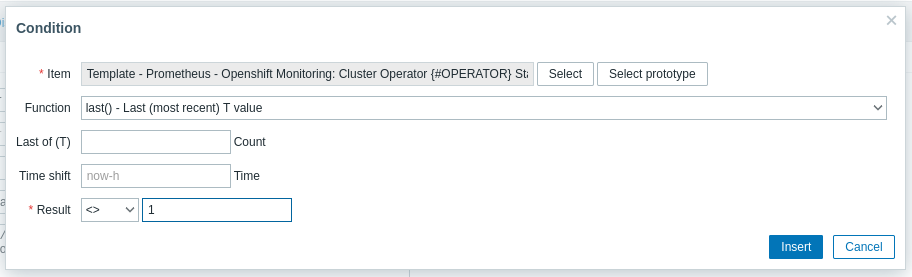
To add the Expression, click Add, fill in the fields below and click Insert:
- Item => Click on Select prototype and select the prototype item created previously.
- Function => Use last() to use the most recent value in the expression.
- Result => Create an expression that informs you when the value of last() is different (<>) from 1.
When finished, the Trigger Prototype will look like this. Click Update.
Create Host
Next, create the Host, which will be responsible for providing the Thanos endpoint and the token for Zabbix. It will receive that template.
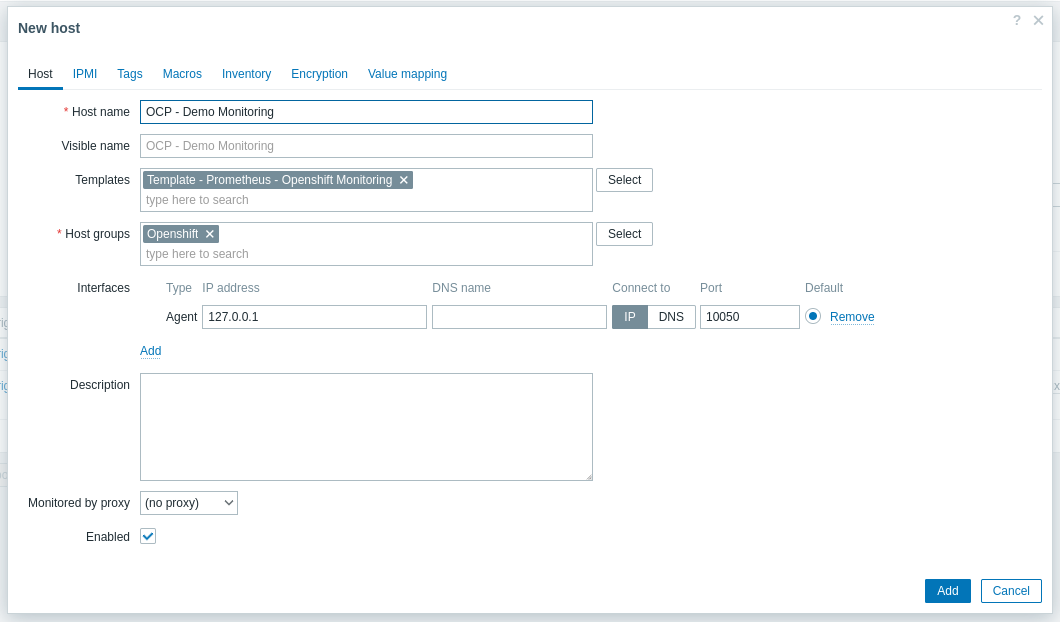
To do this, go to the left side menu, select Data collection > Hosts > Create host and fill in the data below:
| Field | Value | Description |
| Host name | OCP - Demo Monitoring | Specify the desired host name for the host |
| Templates | Template - Prometheus - OpenShift Monitoring | Select the template you just created |
| Host groups | Openshift | Select the Host Group you just created |
| Interfaces | Agent | Add an agent-type interface, using IP 127.0.0.1 |
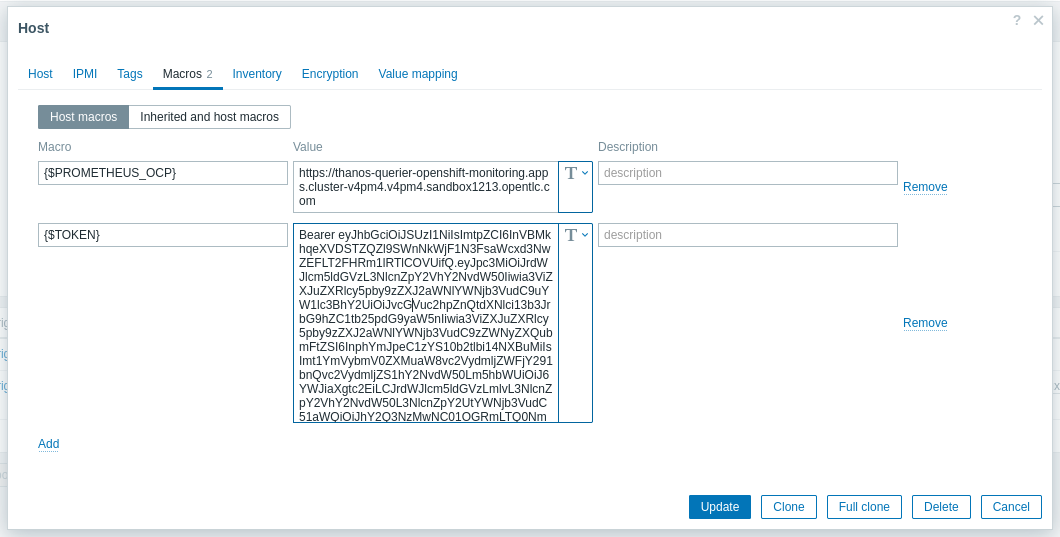
Click on Macros at the top. Add two macros. The first will receive the thanos-querier endpoint, and the second will receive the zabbix-sa serviceaccount token. Both were collected in the first step of this article.
Click Add and add the following macros:
| Macro | Value | Description |
| {$PROMETHEUS_OCP} | https://thanos-querier-openshift-monitoring.apps.cluster.domain.com | Add the thanos-querier route using https:// |
| {$TOKEN} | Bearer YOUR_TOKEN_HERE | Add the zabbix-sa serviceaccount TOKEN, following this format |
Click Update to finish creating the host. Wait until the LLD is executed.
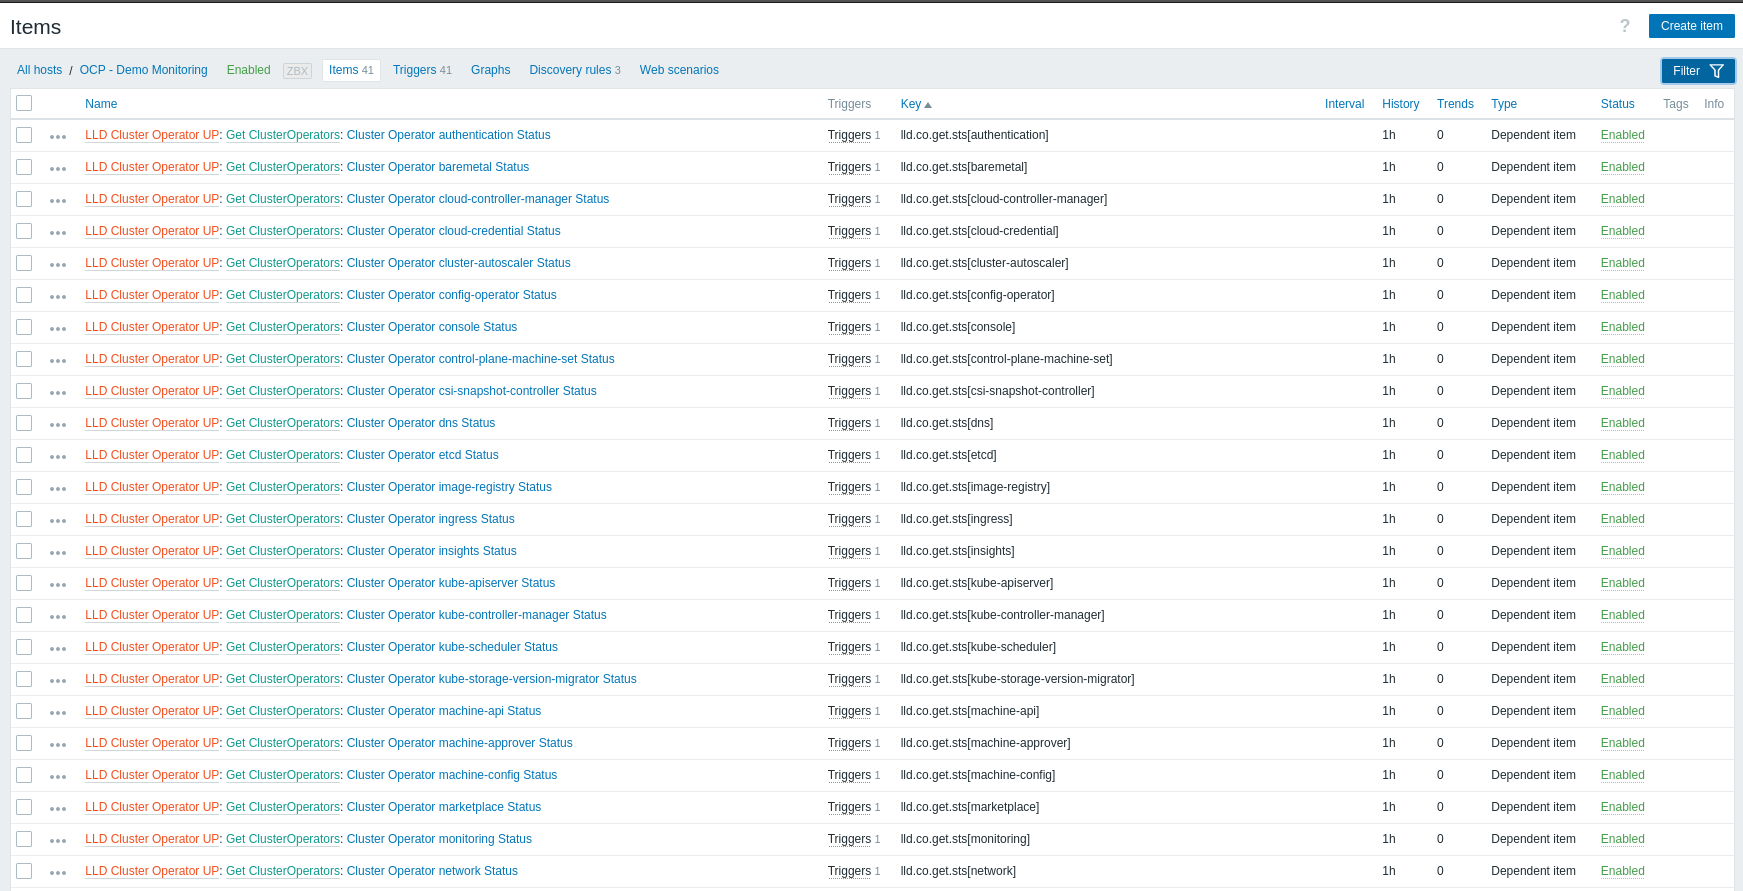
Once the LLD executes, Items and Triggers will be created on the host. To validate these, click on Items.
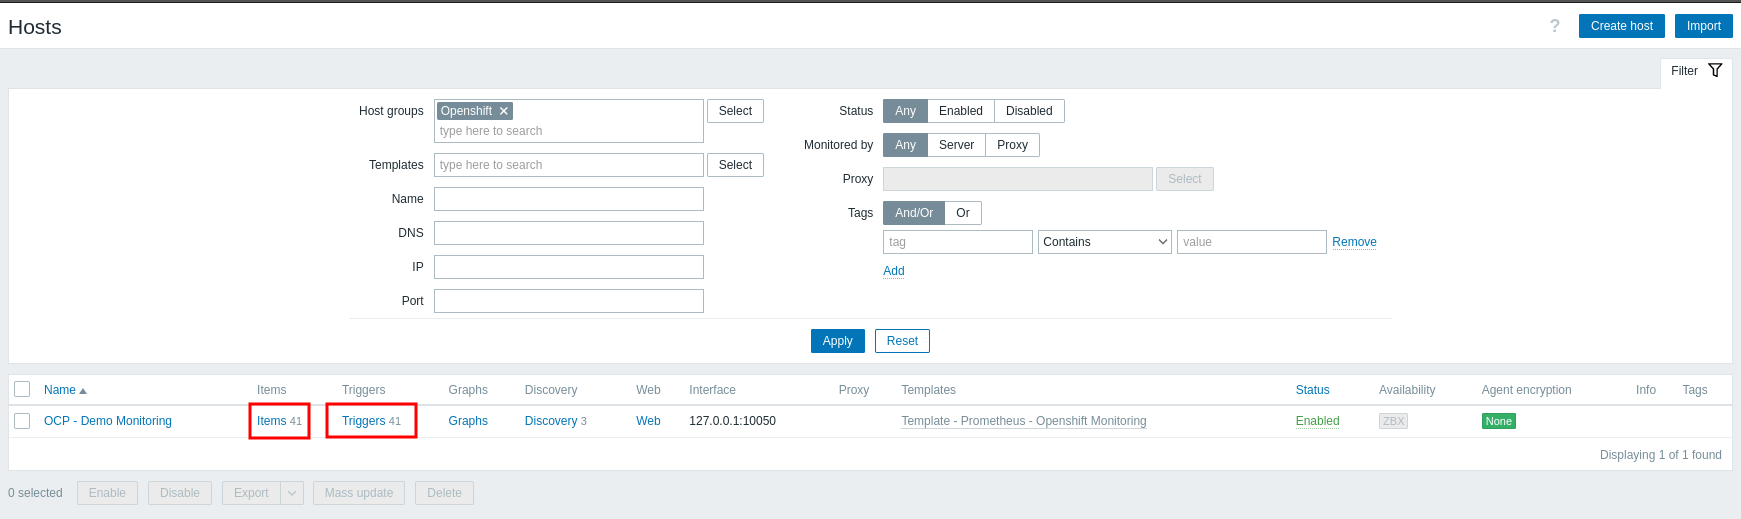
You can view all the items created. Each ClusterOperator has its respective trigger created through LLD.
To validate what data is being collected, in the left side menu, click Monitoring > Latest data.
You can view information such as item, last check, and the last value collected.

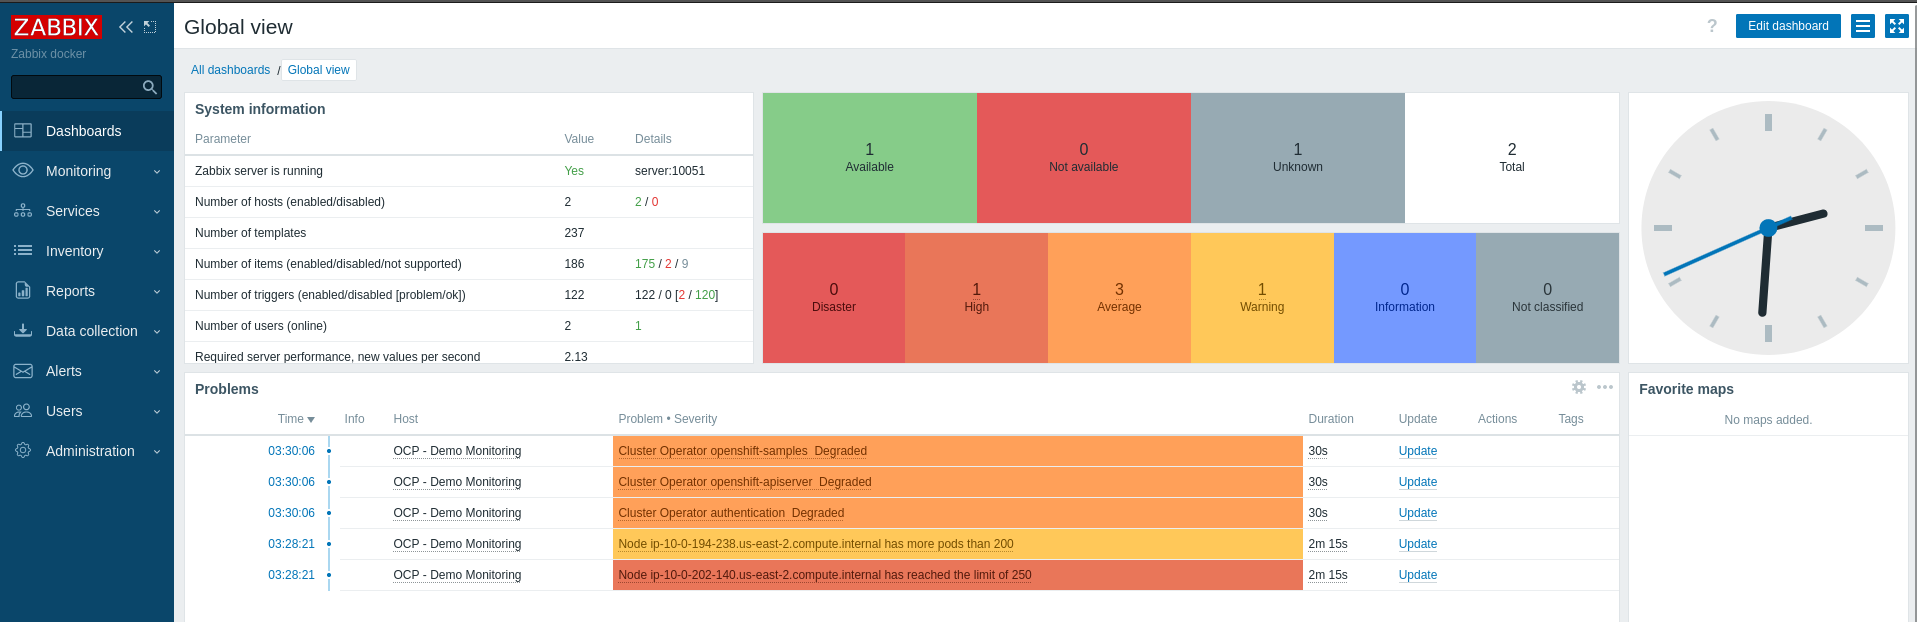
Dashboard
Now validate that the triggers work correctly. Click on Dashboard in the left side menu.
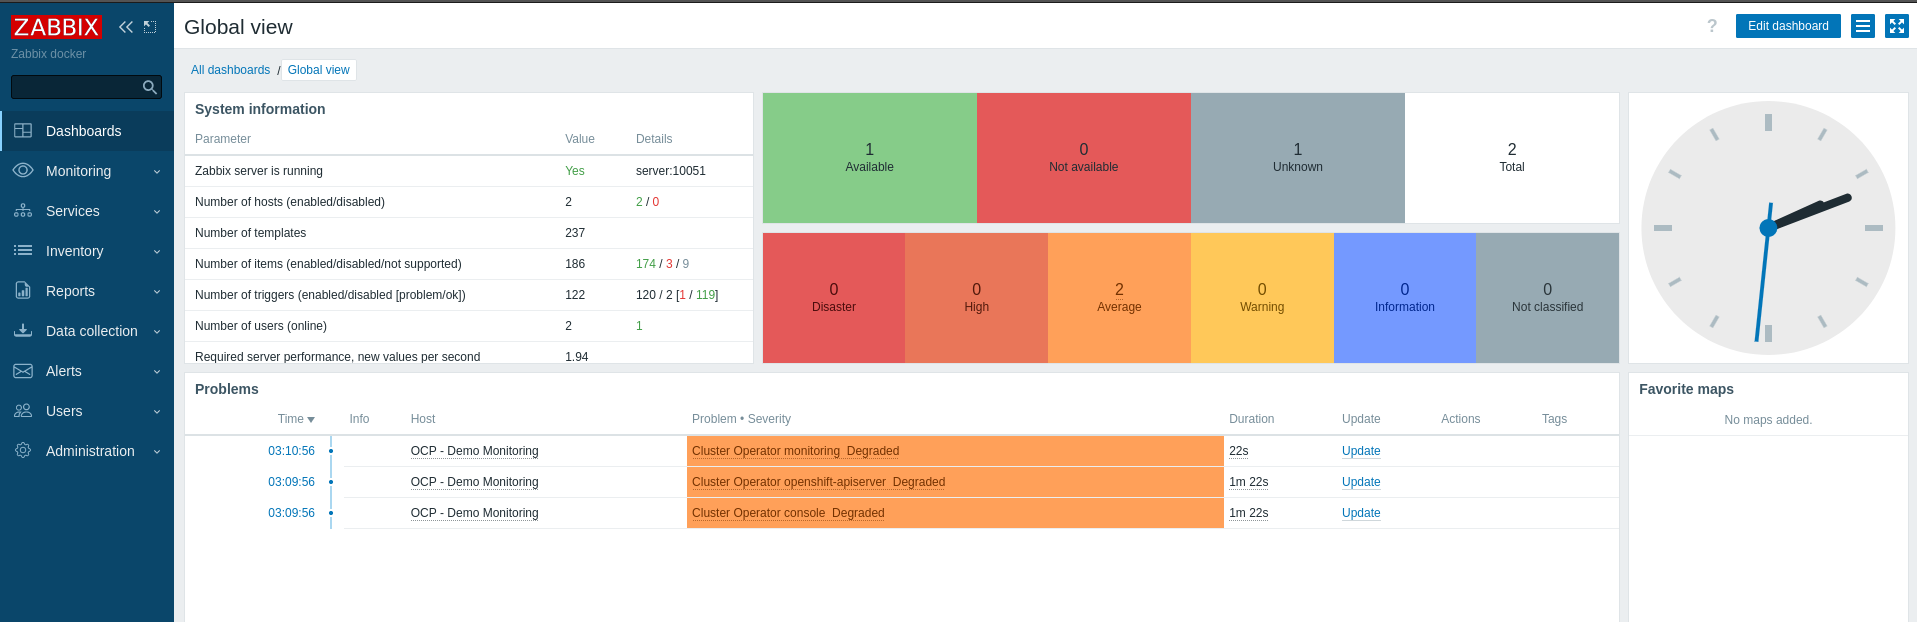
Repeat the process to create new collections. Identify which metrics are useful for your monitoring and your business.
Wrap up
Using the Prometheus/Thanos API and Low Level Discovery, you can collect metrics from the OpenShift cluster and create alerts, SLAs, availability reports, and graphs according to your business rule or need.
References
For more details and other configurations, start with the reference documents below:
Read the articles below to understand other possibilities for monitoring OpenShift clusters using Zabbix and Prometheus.
Sobre el autor
Más como éste
La paradoja agéntica y los argumentos a favor de la IA híbrida
Deja de administrar el pasado y comienza a forjar el futuro de TI
Command Line Heroes en español. Temporada 1: Descifrando el código de la nube abierta
Edge computing covered and diced | Technically Speaking
Navegar por canal

Automatización
Las últimas novedades en la automatización de la TI para los equipos, la tecnología y los entornos

Inteligencia artificial
Descubra las actualizaciones en las plataformas que permiten a los clientes ejecutar cargas de trabajo de inteligecia artificial en cualquier lugar

Nube híbrida abierta
Vea como construimos un futuro flexible con la nube híbrida

Seguridad
Vea las últimas novedades sobre cómo reducimos los riesgos en entornos y tecnologías

Edge computing
Conozca las actualizaciones en las plataformas que simplifican las operaciones en el edge

Infraestructura
Vea las últimas novedades sobre la plataforma Linux empresarial líder en el mundo

Aplicaciones
Conozca nuestras soluciones para abordar los desafíos más complejos de las aplicaciones
Virtualización
El futuro de la virtualización empresarial para tus cargas de trabajo locales o en la nube