
We’re all familiar with top, a real-time system monitor which shows usage of your Linux hardware and network resources. As a top command alternative, atop also provides sysadmins with real-time system insight, and also allows for an anatomized view of which processes are using the most CPU, memory, storage, or network.
Let’s take a look at using atop for Linux server performance analysis.
Advantages of atop
Atop is an ASCII, full-screen performance monitor which can log and report the activity of all server processes. One feature I really like is that atop stays active in the background for long-term server analysis (up to 28 days by default). Other advantages include:
- Shows resource usage of all processes, even those that are closed or completed.
- Monitors threads within processes and ignores processes that are unused.
- Accumulates resource usage for all processes and users with the same name.
- Highlights critical resources using colors (red).
- Adds or removes columns as the size of the display window changes.
- Includes disk I/O and network utilization.
- Uses the
netatopkernel module to monitor TCP, UDP, and network bandwidth.
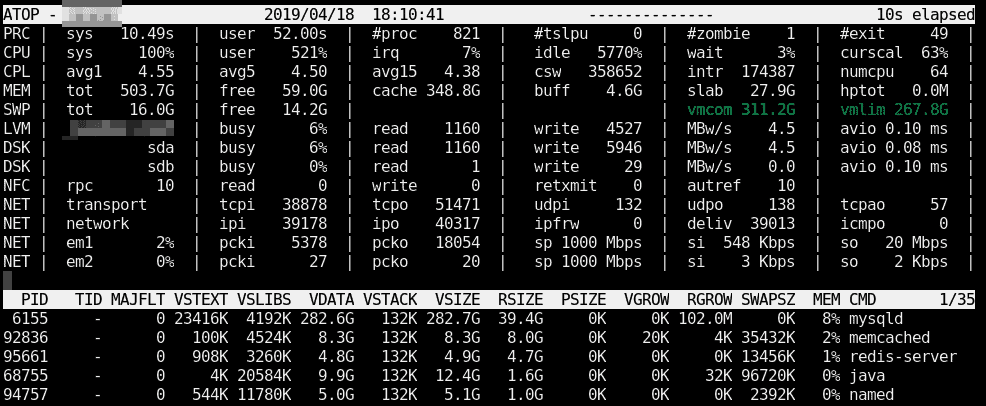
Once atop is launched, by default it shows system activity for CPU, memory, swap, disks, and network in 10-second intervals. In addition, for each process and thread, you can analyze CPU utilization, memory consumption, disk I/O, priority, username, state, and even exit codes:
Install atop on Red Hat Enterprise Linux/CentOS/Fedora Linux
[Want to try out Red Hat Enterprise Linux? Download it now for free.]
First, install and enable the Extra Packages for Enterprise Linux (EPEL) repo. See Red Hat solution #308983 if you’re not sure how to do this. Once that task is complete, you can install atop:
yum install atop
Launch it similar to top, using:
atop
Using atop
When it comes to using atop, a good place to start is to read the man pages:
man atop
Useful atop launch commands include:
| Command | Description |
|---|---|
atop -1 |
Launch with average-per-second total values. |
atop -a |
Launch with active processes only. |
atop -c |
Launch with command-line per process. |
atop -d |
Launch with disk info. |
atop -m |
Launch with memory info. |
atop -n |
Launch with network info. |
atop -s |
Launch with scheduling info. |
atop -v |
Launch with various info (e.g., PPID, user, or time). |
atop -y |
Launch with individual threads. |
Once atop is running, press the following shortcut keys to sort processes:
| Shortcut key | Description |
|---|---|
a |
Sort in order of most active resources. |
c |
Revert to sorting by CPU consumption (default). |
d |
Sort in order of disk activity. |
m |
Sort in order of memory usage. |
n |
Sort in order of network activity. |
Reading atop reports and logs
By default, after installation, the atop daemon writes snapshots to a compressed log file (e.g., /var/log/atop/atop_20140813). These log files can be read using:
atop -r </full/path/to/atop/log/file>
Once you open a log file (e.g., atop -r /var/log/atop/atop_20140813), then use t to go forward in 10-minute intervals, and T to go back. You can analyze specific times by pressing b and then entering the time. The above shortcut keys also work in this mode: a, c, d, m, and n.
You can use shortcuts with atopsar. For example, using the flag -c 30 5 with atopsar generates a report for current CPU utilization for five minutes (10 times with intervals of 30 seconds):
atopsar -c 30 5
Using the flag -A with return all available reports.
atopsar -A
But, you can limit this output to a specific time window using beginning (-b) and end (-e) flags:
atopsar -A -b 11:00 -e 11:15
Wrapping Up
There are some good advantages and unique features of atop, as listed above. Personally, I like how atop allows you to isolate and analyze CPU usage, memory consumption, storage I/O, etc., for each process and thread.
Still, some of us will continue to prefer top or htop, and they are both great tools. After reading this article, I hope more people will also add or continue to use atop as one of their go-to Linux analysis and troubleshooting tools.
저자 소개
Hayden James is a Linux Systems Analyst and Internet Entrepreneur from the Caribbean. He relocated to the US ten years ago, where he maintained Linux servers and sold small startups. Today, he supports clients remotely from his island home while also managing a niche web hosting venture. His web blog features Linux Sysadmin related articles: haydenjames.io.
유사한 검색 결과
Red Hat Enterprise Linux의 이미지 모드를 지금 바로 사용해야 하는 4가지 이유
Red Hat Enterprise Linux, 양자 컴퓨팅 시대를 대비한 SSH 보안 역량 강화
Infrastructure At The Edge | Compiler
Operating System Management | Compiler
채널별 검색

오토메이션
기술, 팀, 인프라를 위한 IT 자동화 최신 동향

인공지능
고객이 어디서나 AI 워크로드를 실행할 수 있도록 지원하는 플랫폼 업데이트

오픈 하이브리드 클라우드
하이브리드 클라우드로 더욱 유연한 미래를 구축하는 방법을 알아보세요

보안
환경과 기술 전반에 걸쳐 리스크를 감소하는 방법에 대한 최신 정보

엣지 컴퓨팅
엣지에서의 운영을 단순화하는 플랫폼 업데이트

인프라
세계적으로 인정받은 기업용 Linux 플랫폼에 대한 최신 정보

애플리케이션
복잡한 애플리케이션에 대한 솔루션 더 보기
가상화
온프레미스와 클라우드 환경에서 워크로드를 유연하게 운영하기 위한 엔터프라이즈 가상화의 미래