Elasticsearch comes as a set of blocks, and you—as a designer—are supposed to glue them together. Yet, the way the software comes out of the box does not cover everything. So, to me, it was not easy to see the cluster’s heartbeat all in one place. I needed something to give me an overview as well as allow me to take action on basic things.
I wanted to introduce you to a helpful piece of software I found: Cerebro.
According to the Cerebro GitHub page:
Cerebro is an open source (MIT License) elasticsearch web admin tool built using Scala, Play Framework, AngularJS, and Bootstrap.
After you clone the Git repository and run /bin/cerebro with the right user permissions, you can log into http://localhost:9000. I’ll save some "paper" by not following the initial configuration and auth setup, but I presume people will work it out easily.
Once everything's set up, you come to the login screen:

And here is the main screen after successfully logging in:

Here, we see a table view with indexing nodes (left vertical), daily indexes (top horizontal), and shard indices (chunks of data numbered one, two, three, etc.)
From this point, we can monitor and manipulate (close, delete) indexes, nodes, and overall see the whole cluster’s status. For example, if we run an API call to resync corrupted shards to another node, we can watch the progress on this screen. This is important visibility into what’s going on because with big data something is always more or less broken.
Here, we lost one indexing node. We might need to check if the link is up and the Elasticsearch process has not crashed on that particular node. If we bring the node back online, this dashboard shows you the replication progress in real-time:

Or, here we have an issue with individual shard indices. They are probably corrupted and need a fix and then manual replication:

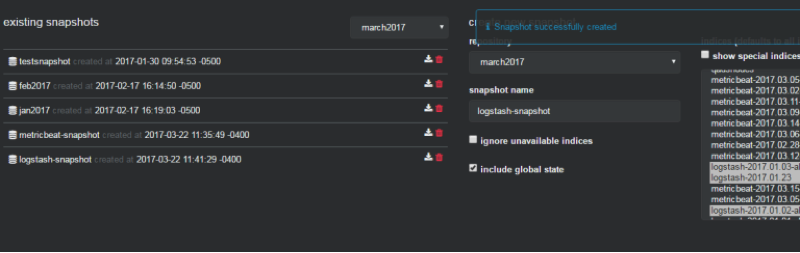
There are also cluster configuration menus, and one of the options I found interesting and useful was "snapshots." Sometimes, we need to archive and rotate data to recover free space. Call the snapshot backups, for example, if you have to keep a few years’ data for an external audit.
There are scripts that normally do this for you in the background, so this GUI allows you to browse the indices easily, and open or activate a particular index or day on-demand in one click:
To summarize, I would say this tool saves my nerves and my time when investigating trivial situations. I take a quick look at Cerebro and I know what happened with my cluster. Overall, I found this software stable, useful, and a good addition to my ELK admin toolbox.
Want to learn more advanced techniques for monitoring in Linux? Check out The open source guide to DevOps monitoring tools.
저자 소개
Danil Mashonkin was born in Sverdlovsk (Yekaterinburg) former USSR in 1973 and received a degree from the Ural's University of Communications in 1992. He began as a and 1996 and quicly transitioned into IT as a full stack C programmer in 1999.
He got into open source in 2004 with Adelaide, who is well-known for their open source integrator for non profits. In 2007, he began working for a healthcare supplier and their migration to open source projects like Nortel to Asterisk, Pronto ERP to Adempiere, Postgres SQL, and so on. Since 2009, he was partially in a DevOps position along with being a sysadmin.
In 2011, he started his own IT consultancy business providing Proxmox virtualization systems design, delivery, and support. Then in 2016, he began doing InfoSec work with Global Payments as Linux and Security Engineer mainly responsible for monitoring systems, patch management, SIEM, big data, and others tasks.
He joined Red Hat IT Operations in 2018. He likes to build boats and then drive, ride, and sail them.
유사한 검색 결과
빠르게 진화하는 AI 위협, 더 빠른 대응
관리에서 벗어나 오케스트레이션으로 전환: Red Hat Ansible Automation Platform을 통한 Catalyst 운영 간소화
Untangling Networks | Compiler
Operating System Management | Compiler
채널별 검색

오토메이션
기술, 팀, 인프라를 위한 IT 자동화 최신 동향

인공지능
고객이 어디서나 AI 워크로드를 실행할 수 있도록 지원하는 플랫폼 업데이트

오픈 하이브리드 클라우드
하이브리드 클라우드로 더욱 유연한 미래를 구축하는 방법을 알아보세요

보안
환경과 기술 전반에 걸쳐 리스크를 감소하는 방법에 대한 최신 정보

엣지 컴퓨팅
엣지에서의 운영을 단순화하는 플랫폼 업데이트

인프라
세계적으로 인정받은 기업용 Linux 플랫폼에 대한 최신 정보

애플리케이션
복잡한 애플리케이션에 대한 솔루션 더 보기
가상화
온프레미스와 클라우드 환경에서 워크로드를 유연하게 운영하기 위한 엔터프라이즈 가상화의 미래