
Background
In our previous article “Cost Management: Bean Counting for OpenShift”, we set up Cost Management for managing per department billing. This helps us to bill internally for the consumption of an OpenShift-based platform.
We can also use Cost Management to analyze other aspects of our platform. As a procurement person or CTO, analyzing how software is being deployed and used can give surprising insight on the company’s technological direction. Use of unexpected software can be taken as a point of investigation, paid software can be monitored for cost projections, and this information can contribute to future decisions, particularly in regard to changing usage patterns compared to traditional infrastructures.
To illustrate, we have deployed several kinds of applications on OpenShift across multiple projects. This will allow us to see how we can combine software usage data across projects to measure consumption.
How to measure software use
OpenShift Environment Setup
Software Setup
In our previous article, we worked with two projects:
- america
- europe
Each project has software components in it that we would like to have greater overall visibility of. In our previous article, a department label was created on both projects to allow us to bill usage to the owning departments (see “Cost Management: Bean Counting for OpenShift”).
Each project contains several pods, and these pods run a variety of software. We would like to label each pod with the software it is running.
Software Tagging
We have introduced a new label key: costmanagement.tracking.software
By tagging our pods appropriately with this key and an appropriate value, we can indicate to Cost Management which software is running.
For our workload, a combination of JBoss EAP, Nginx and Python pods, we have introduced these label values:
|
Label |
Value |
|
costmanagement.tracking.software |
python |
|
costmanagement.tracking.software |
nginx |
|
costmanagement.tracking.software |
jboss-eap |
To ensure that they survive a redeployment, these labels need to be introduced as part of the pod-template section of the associated Deployment or Deployment Configuration. Those responsible for writing these specifications (often developers), will need to understand this need. Alternatively, this can be enforced as part of checks in policy tooling such as Advanced Cluster Security.
Europe has the following deployments and deployment configurations:
- EAP application - DeploymentConfig
- Nginx application - Deployment
america has the following software deployed in it:
- EAP application - DeploymentConfig
- Python application - Deployment
The below code samples are excerpts of the changes in the above pod-templates:
Deployment for the Python application:
kind: Deployment
apiVersion: apps/v1
metadata:
 name: python-sample
 namespace: america
spec:
...
 template:
   metadata:
     labels:
       app: python-sample
       costmanagement.tracking.software: python
       deploymentconfig: python-sample
       environment: dev
...
DeploymentConfig for the EAP application:
kind: DeploymentConfig
apiVersion: apps.openshift.io/v1
metadata:
 name: eap-app
 namespace: europe
spec:
...
 template:
   metadata:
     name: eap-app
     labels:
       costmanagement.tracking.software: jboss-eap
       deploymentConfig: eap-app
       application: eap-app
       environment: uat
...
Cost Management information
After running the labeled pods (as above) for a day or more, the Cost Management service has collected enough information to show their utilization of CPU/Memory. We can group the pods by the value of their costmanagement.tracking.software label:

As we can see, software that isn’t tracked currently makes up most of the cluster’s costs. The jboss-eap pods are spread across multiple projects, potentially with multiple cost centers, but they are rolled up in this view into a single data point.
If we want to explore how a particular piece of software is being used across departments, we can use the Cost Explorer. Below, you can see the breakdown of jboss-eap value for the costmanagement_tracking_software tag that will allow us to understand the breakdown per team/department:

We can achieve this by grouping by the costmanagement.tracking.department label, and filtering by the costmanagement.tracking.software label with value jboss-eap.
This expands what we saw in Part 1 of this series, where we introduced the costmanagement.tracking.department tag. As we have enhanced the information Cost Management can address with software metadata, we can see that both departments run JBoss EAP software - we can also see the variation in cost over the month.
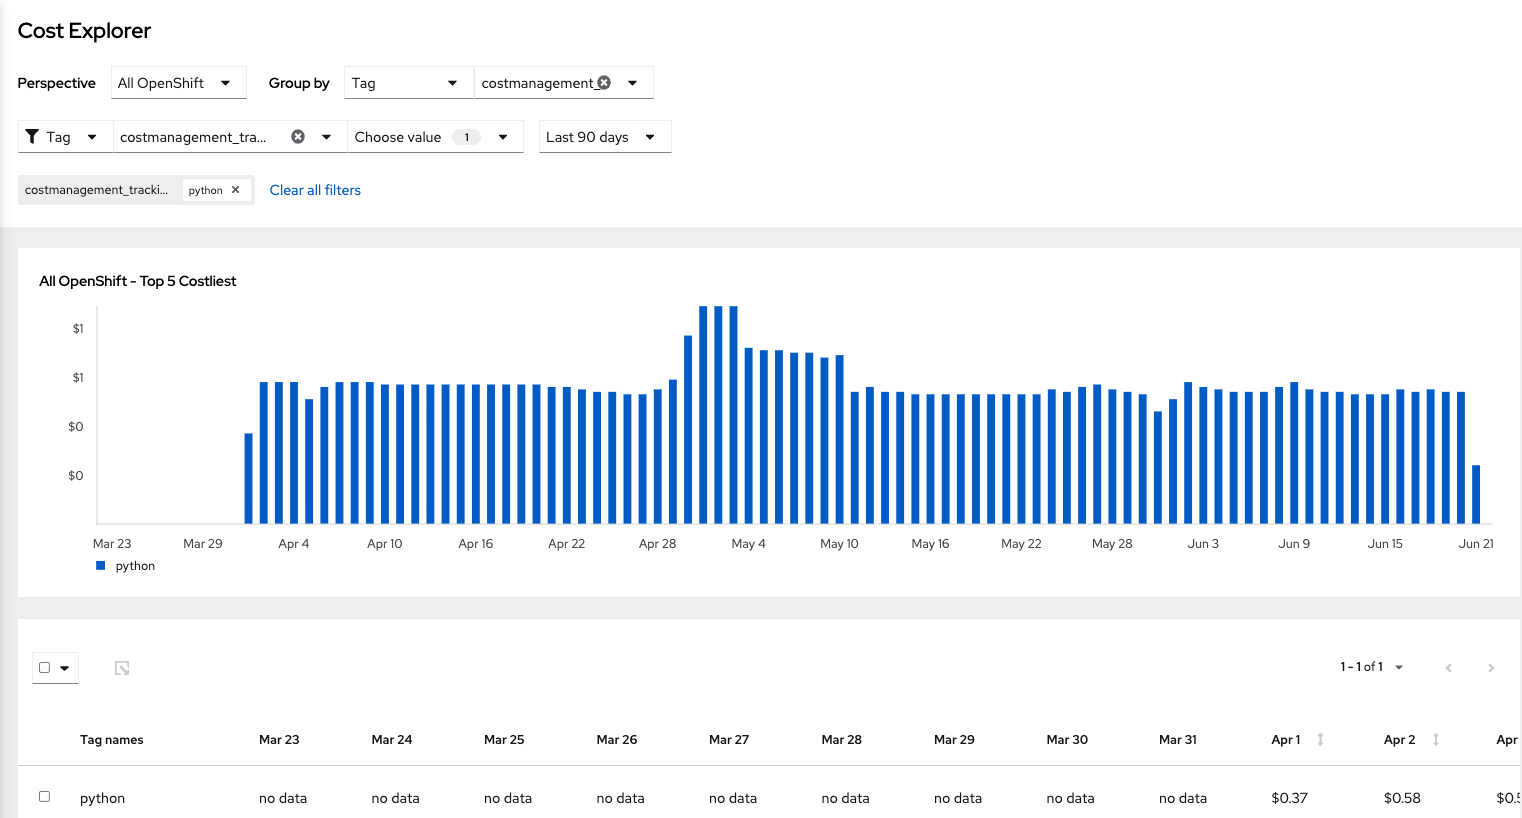
We could also use the Cost Explorer to show the overall usage of costmanagement.tracking.software for Python over the last 90 days. In this case, we can see that Python was introduced in April, allowing us to deduce that Python was introduced to the cluster (in a trackable form) on that date. We could also see the increase or decrease of this software usage over time.
For more information on how much memory or CPU a piece of software has consumed, we can find information through the Cost overview for the label/value combination, as shown below:
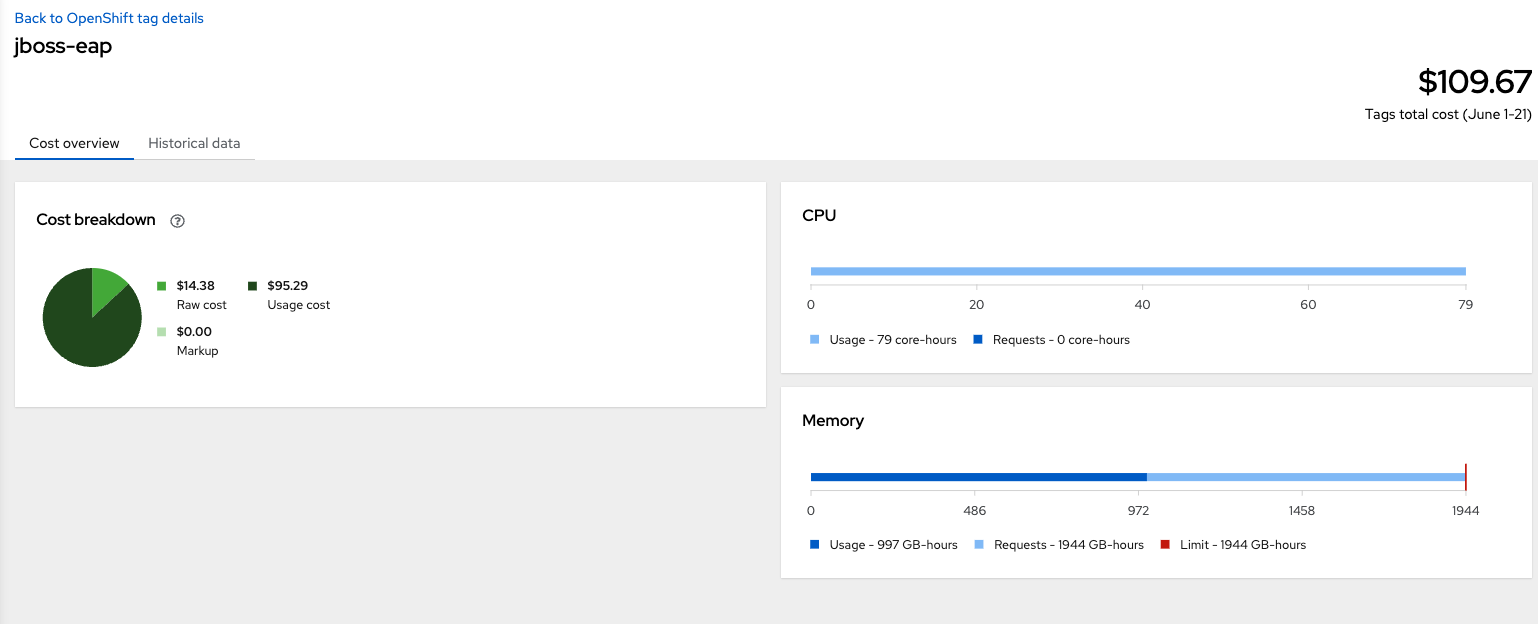
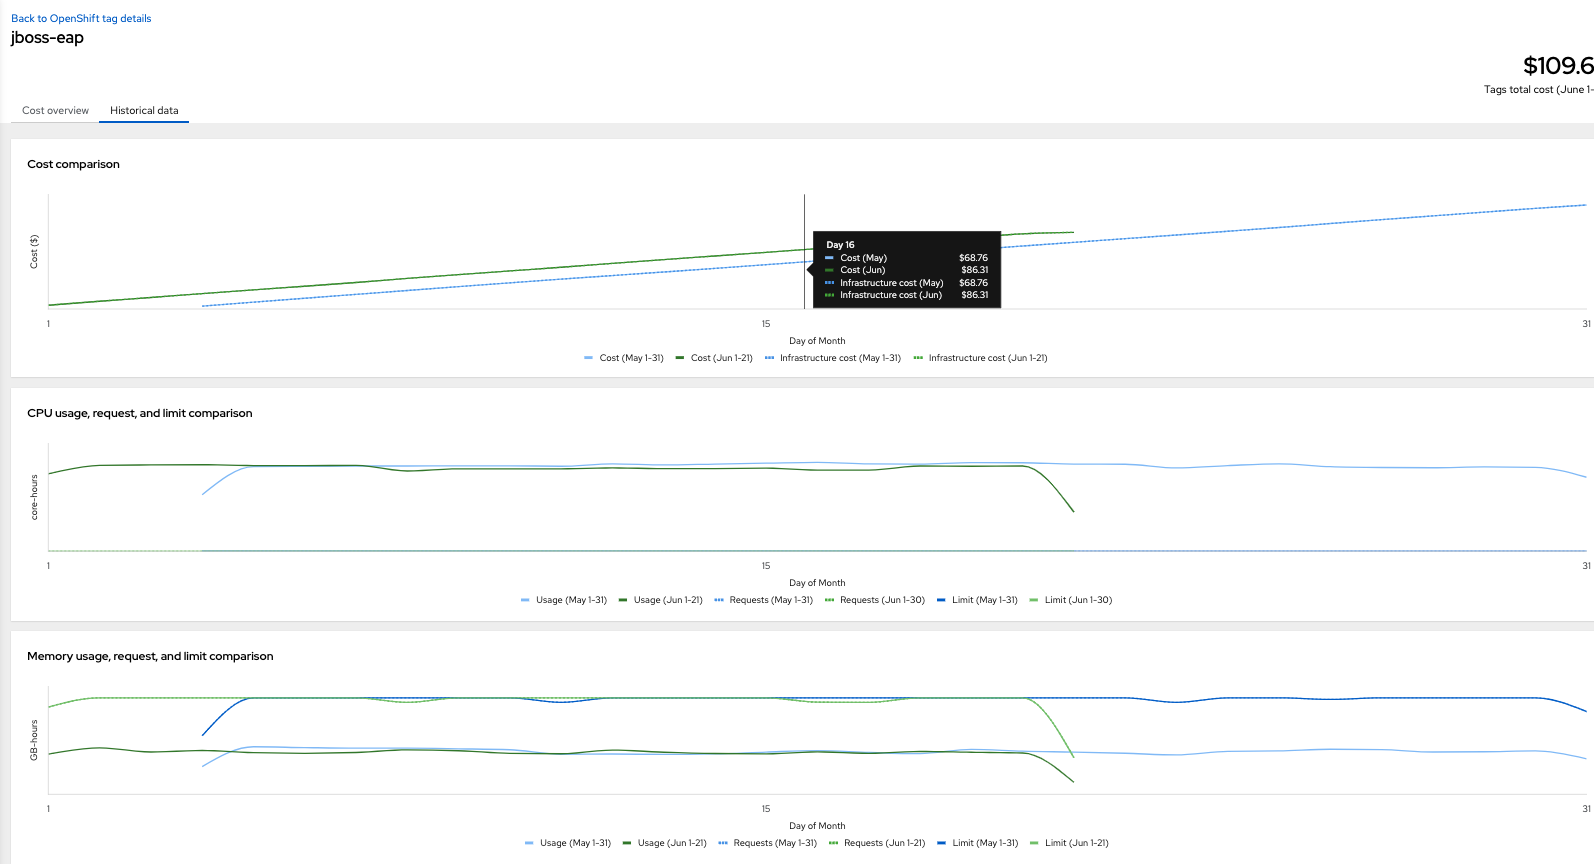
This can be useful when we are specifically looking to track how much CPU/memory has been used now vs last month. Numerical information is relevant but historical information, in the form of graphs, is also available in the Historical data tab:
Programmatic output
Some teams may wish to track software usage over a protracted period of time. At present, it is not possible to utilize that data straight from the UI. However, there are 2 ways of extracting information that can be more readily manipulated:
- Export in CSV format (See below)
- Using API calls which extract the exact data required for calculations, on a scripted basis.
We can export CSV information from the UI:

Note that this export method only provides daily data for the prior 30 days or so. If you wish to use the CSV export, it may be worth exporting on a more frequent basis to ensure no information is lost.
To generate information on a scheduled basis, we can use a reports API. This is outlined in the Red Hat Hybrid Cloud Console API documentation. Specific information on the reports endpoint and its parameters is available here.
Note that access to the API is granted according to an API key, so any programmatic access will need to follow this process to obtain one: https://access.redhat.com/articles/3626371
Here are some examples:
- To fetch monthly compute usage, overall, for all projects:
https://console.redhat.com/api/cost-management/v1/reports/openshift/compute/?filter[time_scope_units]=month&filter[time_scope_value]=-1&filter[resolution]=monthly&group_by[project]=* - To fetch daily usage information for all loads tagged with the costmanagement_tracking_software tag, for the last 90 days:
https://console.redhat.com/api/cost-management/v1/reports/openshift/compute/?group_by[tag:costmanagement_tracking_software]=*&filter[resolution]=daily&filter[time_scope_units]=day&filter[time_scope_value]=-90 - To fetch daily usage information for all loads tagged with the costmanagement_tracking_software=jboss-eap tag/value pair, for the last 90 days:
https://console.redhat.com/api/cost-management/v1/reports/openshift/compute/?filter[tag:costmanagement_tracking_software]=jboss-eap&filter[resolution]=daily&filter[time_scope_units]=day&filter[time_scope_value]=-90 - To fetch CSV information, we use something like the following curl "https://console.redhat.com/api/cost-management/v1/reports/openshift/cos…" -u username:password -H "Accept:text/csv" -o june.csv
Either the JSON or CSV information can then be ingested into another tool of our choice to amalgamate historical information, or create trend graphs.
What can be done with that information
Once the measurements have taken place, an organization can decide to use the information to create KPIs for increasing or decreasing the usage of certain resources.
According to CNCF (Cloud Native Computing Foundation), a large number of organizations do not measure cost or utilization of their kubernetes platform. This will help the stakeholders of the container platform, or Information Technology in general, make more informed decisions on the usage and consumption of their selected software.
The Cost Management service for OpenShift will only provide access to information on a daily basis. This means that low-duration peaks (such as a spike in usage by a serverless workload for a couple of hours) won’t be accurately measured. However, this does provide a starting point to understand trends. With that in mind, this information may help in discussions for commercial purposes as well.
Conclusion
We discussed using the Cost Management service to track usage of software on OpenShift, focusing on labeling workload (pods) to allow Cost Management to track their resource usage. We explored using the UI to find basic information, as well as the API for more detailed information.
저자 소개
유사한 검색 결과
과거의 운영 방식에서 벗어나 IT의 미래 구축
AI의 다음 변곡점: 에이전트를 엔터프라이즈 슈퍼유저로 전환
Crack the Cloud_Open | Command Line Heroes
Edge computing covered and diced | Technically Speaking
채널별 검색

오토메이션
기술, 팀, 인프라를 위한 IT 자동화 최신 동향

인공지능
고객이 어디서나 AI 워크로드를 실행할 수 있도록 지원하는 플랫폼 업데이트

오픈 하이브리드 클라우드
하이브리드 클라우드로 더욱 유연한 미래를 구축하는 방법을 알아보세요

보안
환경과 기술 전반에 걸쳐 리스크를 감소하는 방법에 대한 최신 정보

엣지 컴퓨팅
엣지에서의 운영을 단순화하는 플랫폼 업데이트

인프라
세계적으로 인정받은 기업용 Linux 플랫폼에 대한 최신 정보

애플리케이션
복잡한 애플리케이션에 대한 솔루션 더 보기
가상화
온프레미스와 클라우드 환경에서 워크로드를 유연하게 운영하기 위한 엔터프라이즈 가상화의 미래