OpenShift administrators often face the same challenges as other system administrators: "I need a tool that will monitor the health of my system." Yet, traditional monitoring tools often fall short in their visibility of an OpenShift cluster. Thus, a typical OpenShift monitoring stack includes Prometheus for monitoring both systems and services, and Grafana for analyzing and visualizing metrics.
Administrators are often looking to write custom queries and create custom dashboards in Grafana. However, Grafana instances provided with the monitoring stack (and its dashboards) are read-only. To solve this problem, we can use the community-powered Grafana operator provided by OperatorHub.
2023 Gartner® Magic Quadrant™에서 리더로 선정된 Red Hat
Red Hat은 Gartner 2023 Magic Quadrant 컨테이너 관리 부문의 실행 능력 및 비전의 완성도에서 최고점을 획득했습니다.
Disclaimer: Community Operators are operators which have not been vetted or verified by Red Hat. Community Operators should be used with caution because their stability is unknown. Red Hat provides no support for Community Operators.
I followed the steps below to deploy a community-powered Grafana operator 3.5.0 from OperatorHub on a running OpenShift 4.5 cluster. This allowed me to write custom queries against the built-in Prometheus to extract metrics relevant to me, and in turn I’m able to create custom dashboards to visualize those metrics.
Deploying Custom Grafana
The community-powered Grafana cannot be deployed to the existing openshift-monitoring namespace, so we will create a new namespace (e.g. my-grafana) to deploy into instead. Navigate to OperatorHub and select the community-powered Grafana Operator. Press Continue to accept the disclaimer, press Install, and press Subscribe to accept the default configuration values and deploy to the my-grafana namespace. Within some time, the Grafana operator will be made available in the my-grafana namespace.

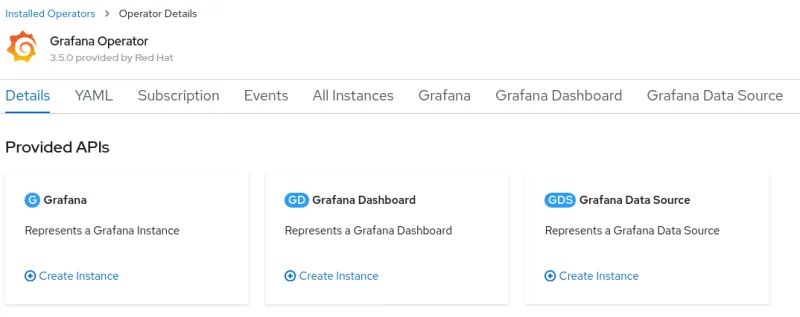
From Installed Operators, select the Grafana Operator. For the Grafana resource, press Create Instance to create a new Grafana instance.

In the Grafana instance YAML, make a note of the default username and password to log in, and press Create.
Connecting Prometheus to our Custom Grafana
The next step is to connect the community supported Grafana in the my-grafana namespace to OpenShift monitoring in the openshift-monitoring namespace.
The grafana-serviceaccount service account was created alongside the Grafana instance. We will grant it the cluster-monitoring-view cluster role.
oc adm policy add-cluster-role-to-user cluster-monitoring-view -z grafana-serviceaccountThe bearer token for this service account is used to authenticate access to Prometheus in the openshift-monitoring namespace. The following command will display this token.
oc serviceaccounts get-token grafana-serviceaccount -n my-grafanaFor new clusters in OpenShift 4.11 and above, support for the above command has been removed. Instead, a service account token secret can be created as follows:
oc create token grafana-serviceaccount --duration=8760h -n my-grafanaFrom the Grafana Data Source resource, press Create Instance, and navigate to the YAML view. In the below YAML, substitute ${BEARER_TOKEN} with the output of the command above, copy the YAML, and press Create.
apiVersion: integreatly.org/v1alpha1
kind: GrafanaDataSource
metadata:
  name: prometheus-grafanadatasource
  namespace: my-grafana
spec:
  datasources:
    - access: proxy
      editable: true
      isDefault: true
      jsonData:
        httpHeaderName1: 'Authorization'
        timeInterval: 5s
        tlsSkipVerify: true
      name: Prometheus
      secureJsonData:
        httpHeaderValue1: 'Bearer ${BEARER_TOKEN}'
      type: prometheus
      url: 'https://thanos-querier.openshift-monitoring.svc.cluster.local:9091'
  name: prometheus-grafanadatasource.yaml
Customizing Grafana
From the my-grafana namespace, navigate to Networking -> Routes and click on the Grafana URL to display the custom Grafana user interface. Click on ‘Sign In’ from the bottom left menu of Grafana, and log in using the default username and password configured earlier. Now, an editable Grafana interface appears and you can view your custom Grafana dashboards or create your own. As a note, administrators should take caution with custom dashboards to query Prometheus as this will have an impact on the performance of the monitoring stack.
To import an existing Grafana dashboard, you can navigate from the Grafana operator menu and create a Grafana Dashboard resource. An alternative is to directly import a custom Grafana dashboard from a JSON file within Grafana. In the screenshot below, I imported a custom Grafana dashboard which displayed the custom metrics I had been looking to view.

Summary
With the community-powered Grafana, an OpenShift administrator can now write their own Prometheus queries to extract metrics and create custom dashboards to visualize the data.
저자 소개
Kevin Chung is a Principal Architect focused on assisting enterprise customers in design, implementation and knowledge transfer through a hands-on approach to accelerate adoption of their managed OpenShift container platform.
유사한 검색 결과
F5 BIG-IP Virtual Edition is now validated for Red Hat OpenShift Virtualization
More than meets the eye: Behind the scenes of Red Hat Enterprise Linux 10 (Part 4)
Command Line Heroes: Season 2: Bonus_Developer Advocacy Roundtable
Can Kubernetes Help People Find Love? | Compiler
채널별 검색
오토메이션
기술, 팀, 인프라를 위한 IT 자동화 최신 동향
인공지능
고객이 어디서나 AI 워크로드를 실행할 수 있도록 지원하는 플랫폼 업데이트
오픈 하이브리드 클라우드
하이브리드 클라우드로 더욱 유연한 미래를 구축하는 방법을 알아보세요
보안
환경과 기술 전반에 걸쳐 리스크를 감소하는 방법에 대한 최신 정보
엣지 컴퓨팅
엣지에서의 운영을 단순화하는 플랫폼 업데이트
인프라
세계적으로 인정받은 기업용 Linux 플랫폼에 대한 최신 정보
애플리케이션
복잡한 애플리케이션에 대한 솔루션 더 보기
가상화
온프레미스와 클라우드 환경에서 워크로드를 유연하게 운영하기 위한 엔터프라이즈 가상화의 미래