
Red Hat OpenShift Service on AWS (ROSA) has three streams of logs: “Audit”, “Infrastructure” and “Application.” The different streams of logs are of interest to different people. For instance the “Audit”logs may be of interest to your Security and Compliance teams, while the “Application” logs may be of interest to an SRE team that is tasked with keeping applications working.
These logs are all viewable from the OpenShift Console or CLI, however in many enterprise use cases you may want to ship them to other systems or tools for further aggregation and analysis.
For example it’s very common to send the “Audit” logs to a Security Information and Event Management (SIEM) system.
OpenShift has several built-in ways to ship logs to another system, and many vendors also have plugins to read or extract logs from OpenShift. In this blog post we’ll explore the built-in Cluster Logging and Cluster Log Forwarding operators, and configure them to ship and store logs to S3 and visualize them with the LokiStack operator.
The instructions in this blog assume that you have a ROSA 4.11 (or higher) cluster already deployed. It is also deploying components to use minimal resources for the sake of demonstration.
Installing and Configuring the Logging Operators
Browse to the AWS S3 console and create a bucket named for your cluster in the same region as your cluster.

Browse to the AWS IAM Policy Console and create a policy
Create a Policy named rosa-loki-stack that contains the following permissions
{
    "Version": "2012-10-17",
    "Statement": [
         {
            "Effect": "Allow",
            "Action": [
                "s3:ListBucket",
                "s3:PutObject",
                "s3:GetObject",
                "s3:DeleteObject"
            ],
            "Resource": [
                "arn:aws:s3:::<bucket_name>",
                "arn:aws:s3:::<bucket_name>/*"
            ]
        }
    ]
}
Create an IAM User named rosa-loki-stack and attach the new “rosa-loki-stack” policy to it.
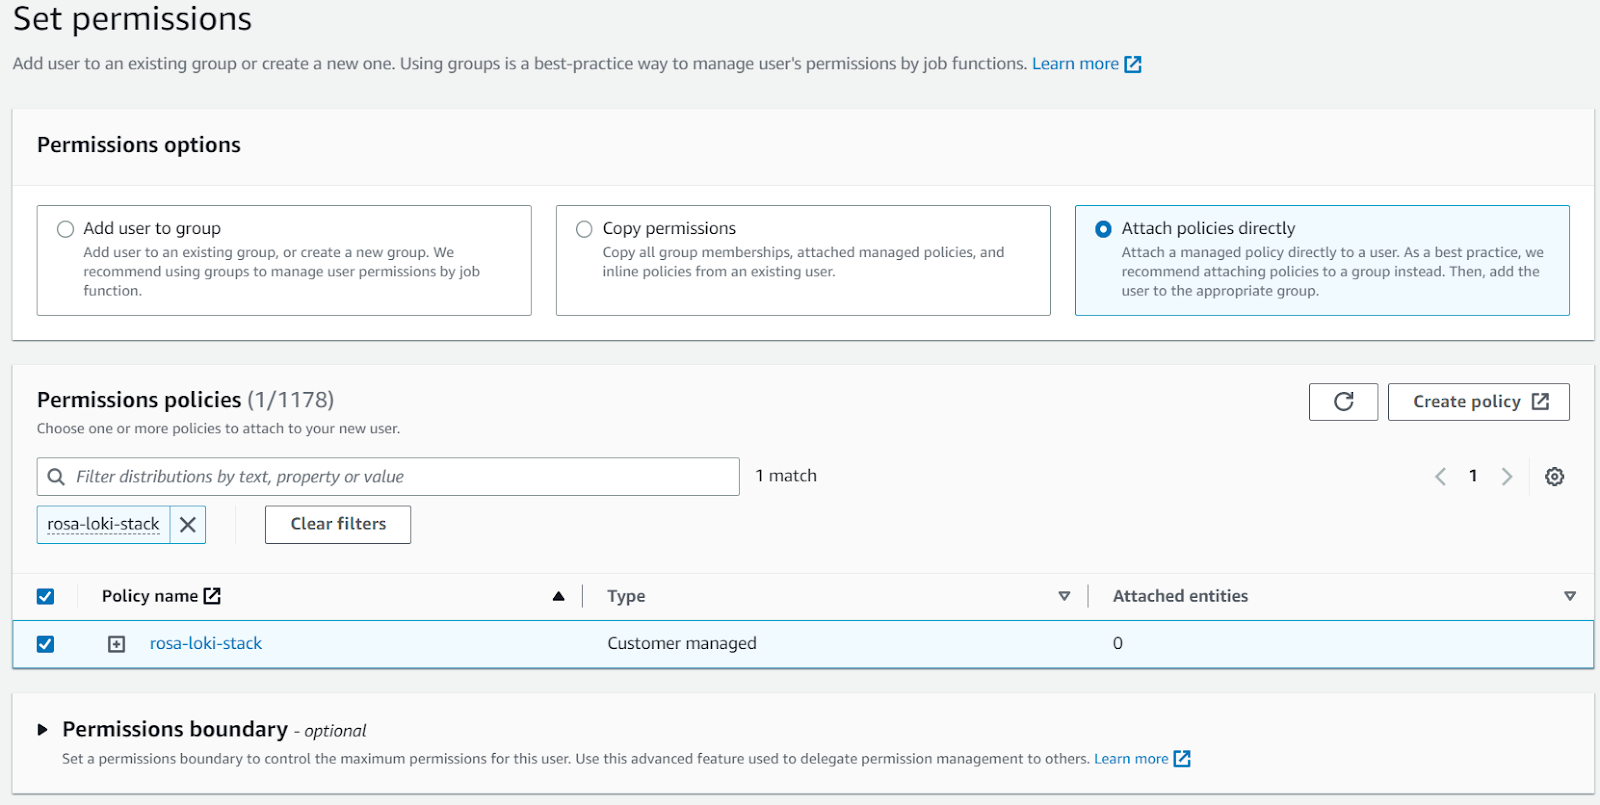
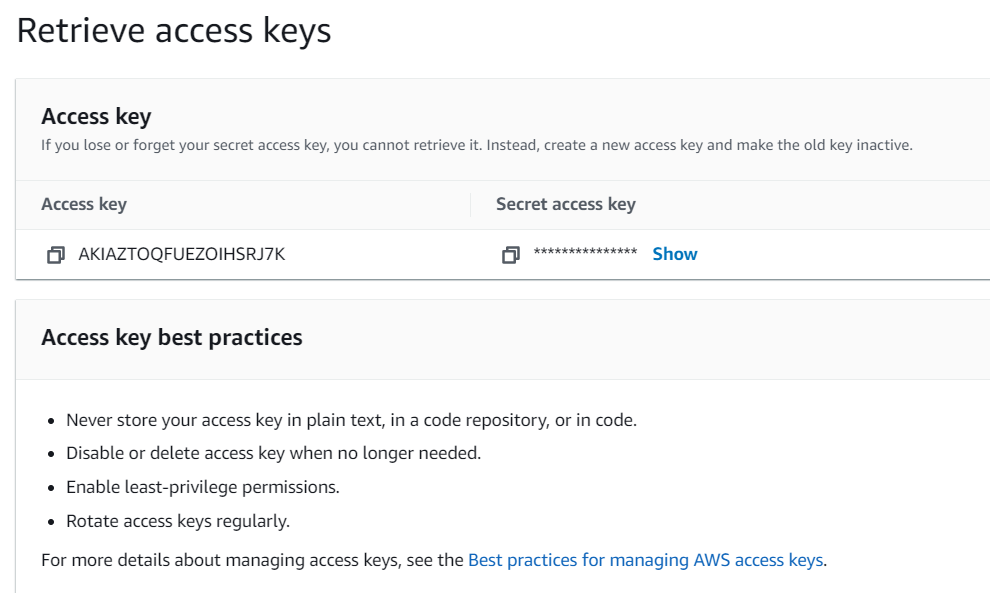
Create IAM Access keys for the new rosa-loki-stack user and paste the credentials to use later
Be sure you’re logged into the OpenShift Console (You can locate and log into your cluster via the OpenShift Cluster Manager Hybrid Cloud Console).
In the OpenShift Console (administrator tools) click Operators > OperatorHub
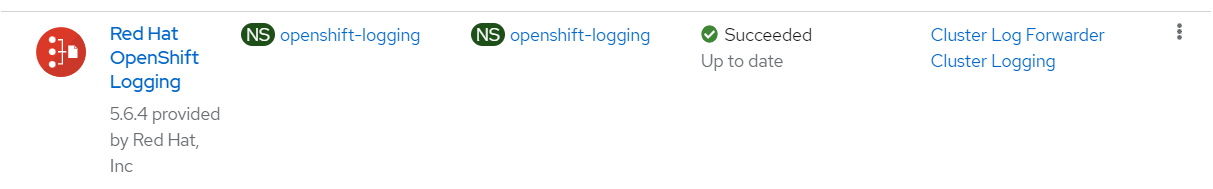
Install the “Red Hat OpenShift Logging” Operator (accept all defaults)
Install the “Loki” Operator (If multiple Operators are available, choose the Red Hat one, accept all defaults)

Click through the OpenShift menu Workloads > Secrets, set the Project to openshift-logging and select Create > From YAML
Paste in the following, ensuring you replace the values to match your environment and hit Create
apiVersion: v1
kind: Secret
metadata:
  name: logging-loki-s3
  namespace: openshift-logging
stringData:
  access_key_id: <access_key_id>
  access_key_secret: <access_key_secret>
  bucketnames: s3-bucket-name
  endpoint: https://s3.<region>.amazonaws.com
  region: <region>

Next click to Operators > Installed Operators > Loki Operator

Click LokiStack / Create instance and pick YAML view, and paste in the following and hit Create.
apiVersion: loki.grafana.com/v1
kind: LokiStack
metadata:
  name: logging-loki
  namespace: openshift-logging
spec:
  size: 1x.extra-small
  storage:
    schemas:
    - version: v12
      effectiveDate: "2022-06-01"
    secret:
      name: logging-loki-s3
      type: s3
  storageClassName: gp3
  tenants:
    mode: openshift-logging

Next click to Operators > Installed Operators > Red Hat OpenShift Logging

Next Cluster Logging -> Create Instance and paste in the following and hit Create.
apiVersion: logging.openshift.io/v1
kind: ClusterLogging
metadata:
  name: instance
  namespace: openshift-logging
spec:
  managementState: Managed
  logStore:
    type: lokistack
    lokistack:
      name: logging-loki
  collection:
    type: vector

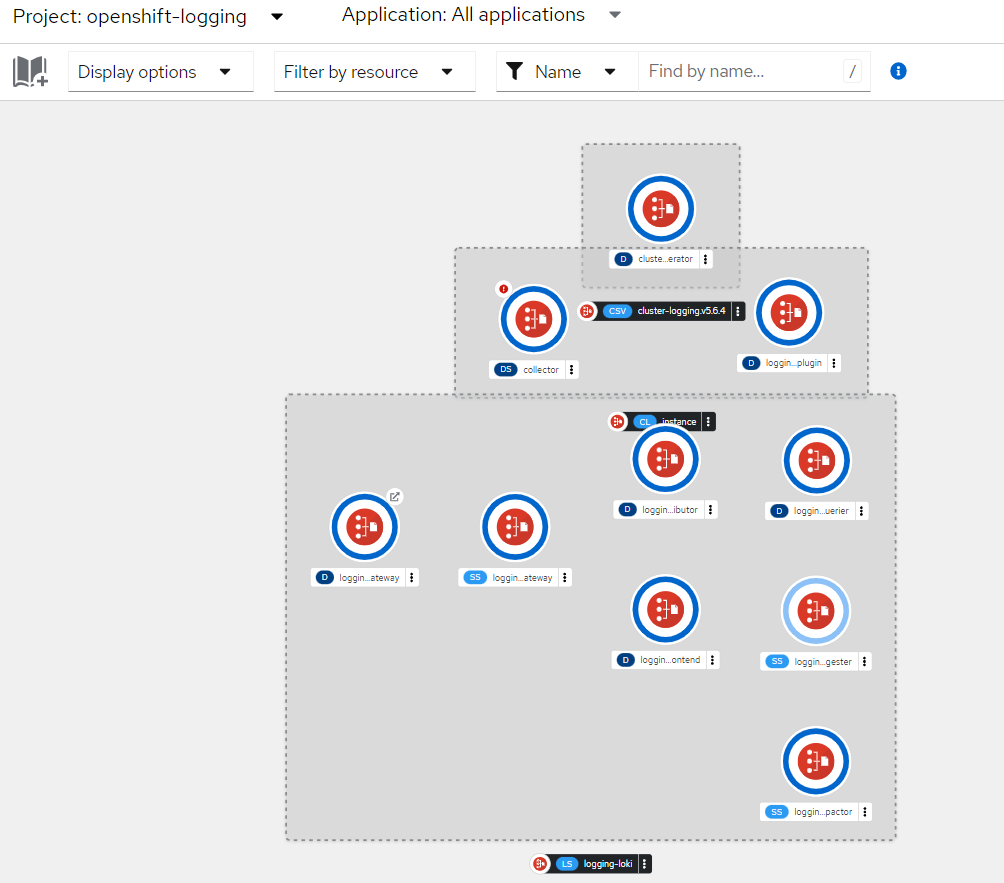
Next you can click to Developer > Topology to see the Logging stack as it deploys
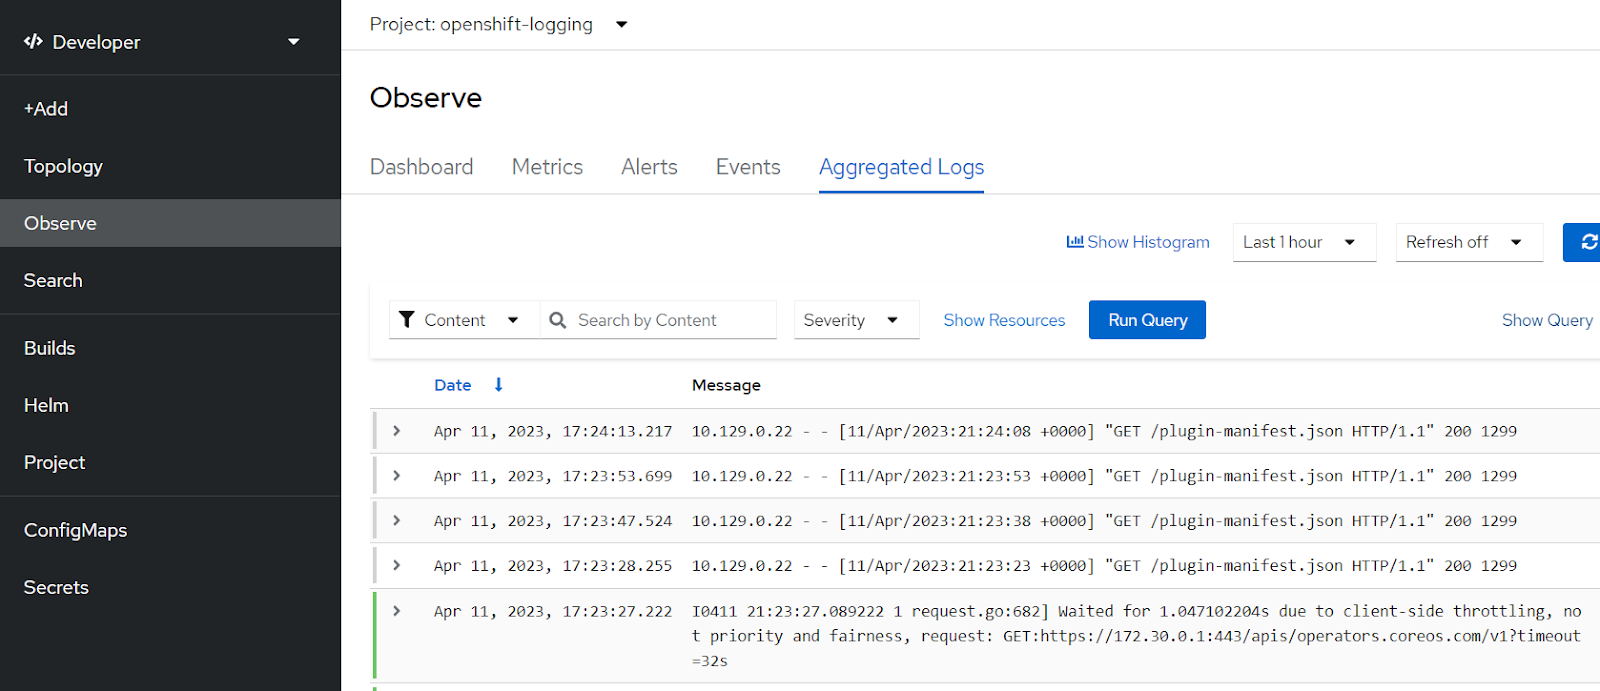
After a few minutes you can check if logs are flowing and viewable by clicking Developer > Observe and selecting Aggregated Logs. (If this menu item isn’t available you may need to refresh your browser).
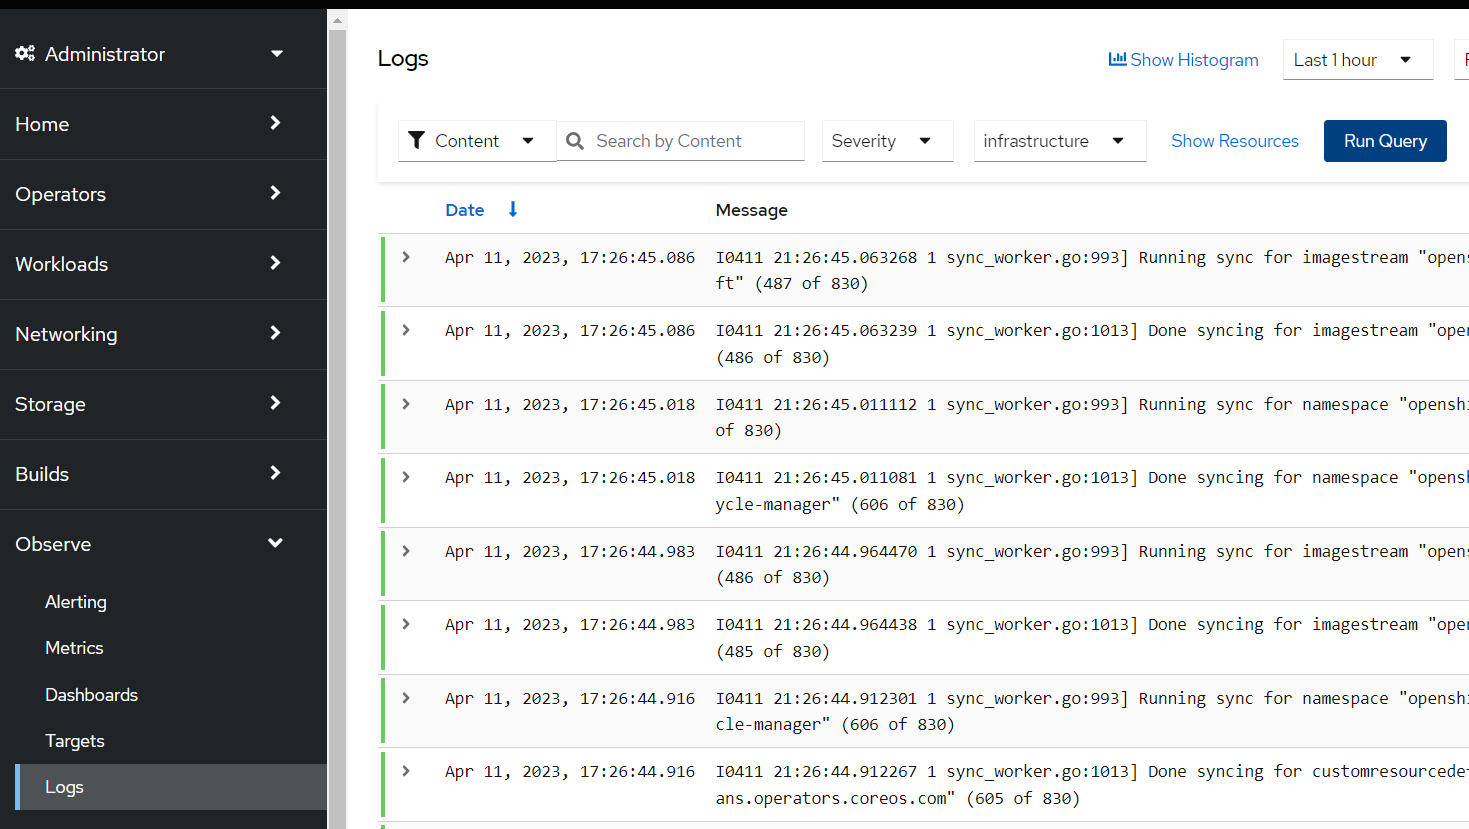
You can also view Infrastructure logs by clicking Administrator -> Observe -> Logs and choosing infrastructure.
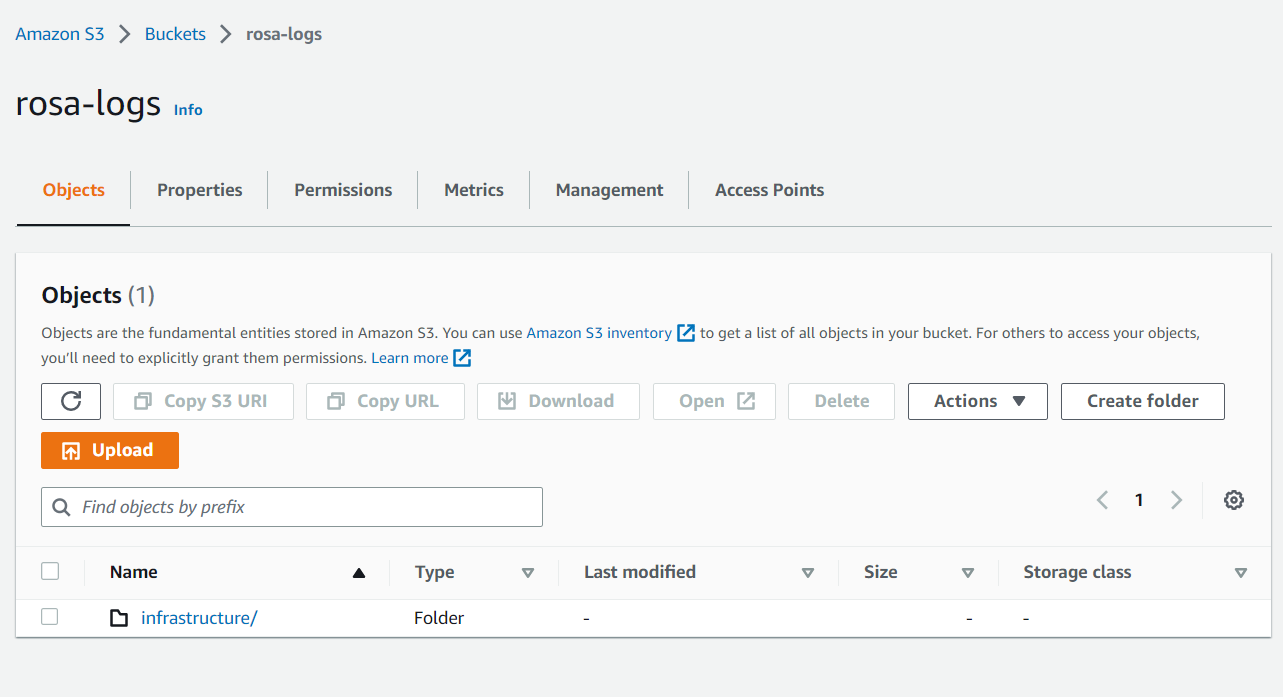
When there’s enough log data Loki will upload it to S3 for long term storage. You can see this by viewing your S3 bucket in the AWS S3 Console.
Congratulations you have successfully configured your ROSA cluster to ship metrics to S3 using the OpenShift Logging and Loki Operators. There is a lot more to explore here, such as capacity planning the Loki infrastructure, Installing Grafana and creating Dashboards, and more.
To learn more about this topic, check out the lightboard video about ROSA logging options.
저자 소개
유사한 검색 결과
과거의 운영 방식에서 벗어나 IT의 미래 구축
AI의 다음 변곡점: 에이전트를 엔터프라이즈 슈퍼유저로 전환
Crack the Cloud_Open | Command Line Heroes
Edge computing covered and diced | Technically Speaking
채널별 검색

오토메이션
기술, 팀, 인프라를 위한 IT 자동화 최신 동향

인공지능
고객이 어디서나 AI 워크로드를 실행할 수 있도록 지원하는 플랫폼 업데이트

오픈 하이브리드 클라우드
하이브리드 클라우드로 더욱 유연한 미래를 구축하는 방법을 알아보세요

보안
환경과 기술 전반에 걸쳐 리스크를 감소하는 방법에 대한 최신 정보

엣지 컴퓨팅
엣지에서의 운영을 단순화하는 플랫폼 업데이트

인프라
세계적으로 인정받은 기업용 Linux 플랫폼에 대한 최신 정보

애플리케이션
복잡한 애플리케이션에 대한 솔루션 더 보기
가상화
온프레미스와 클라우드 환경에서 워크로드를 유연하게 운영하기 위한 엔터프라이즈 가상화의 미래