OpenShift ships with default reaction time for events, for example in case there is an increase in network latency between control plane and worker node. Kube controller manager will wait 40s by default before declaring the worker node is unreachable. For certain use cases, 40s is too fast of a reaction time and might cause unnecessary churn in the infrastructure. Also, once a node is deemed as unhealthy it gets tainted and if pods are part of a deployment set then they are scheduled somewhere else based on their replica count.
By default it takes 300s to kick in and ask the scheduler to schedule the pod. For certain use cases 300s might be too long to start the application. To address all the above concerns we have released WorkerLatencyProfiles in OCP v4.11. Customers can choose between two additional profiles viz. "Medium Update Average Reaction“ or “Low Update Slow reaction“ apart from the Default profile, based on the network conditions of their cluster environment and their application needs.
|
Component |
Flag name |
Default value |
MediumUpdate AverageReaction |
LowUpdate SlowReaction |
|
Kubelet |
node-status-update-frequency |
10s |
20s |
1m |
|
Kube API Server |
default-not-ready-toleration-seconds |
300s |
60s |
60s |
|
Kube API Server |
default-unreachable-toleration-seconds |
300s |
60s |
60s |
|
Kube Controller Manager |
node-monitor-grace-period |
40s |
2m |
5m |
Following scenario showcases the practical usage of the worker latency profile feature on an OpenShift 4.11 Cluster.
Updating the Worker Latency Profile
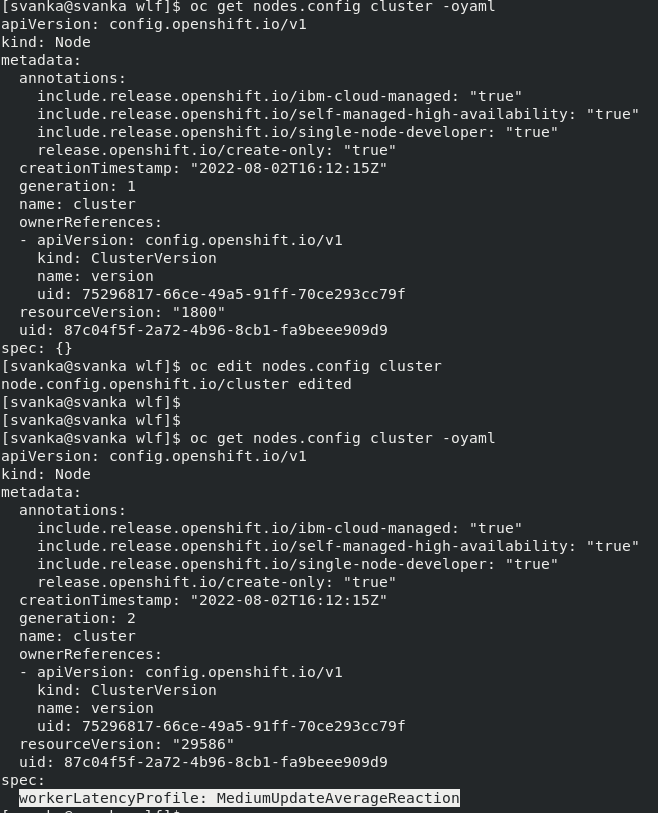
The “nodes.config” custom resource “cluster” is modified as below to update the worker latency profile in an OpenShift 4.11 cluster to “MediumUpdateAverageReaction”
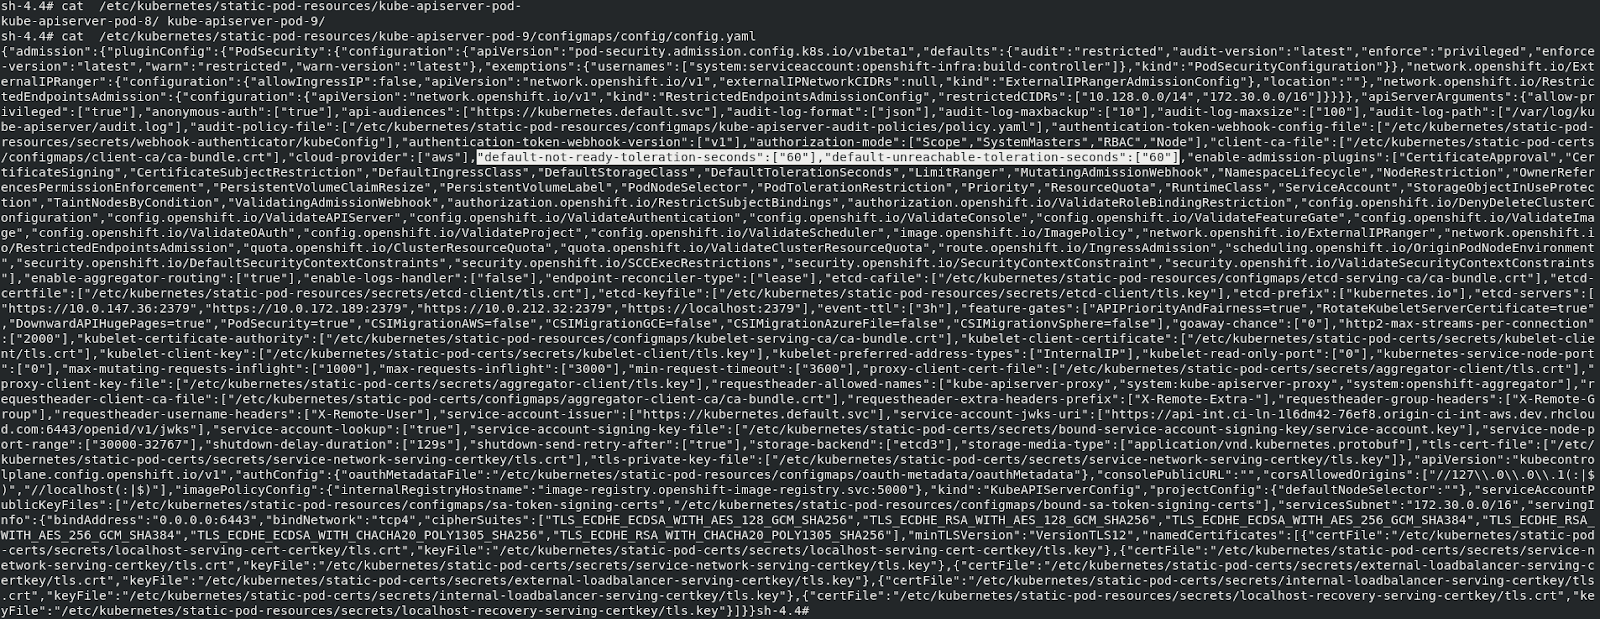
One can verify if the profile is reflected by validating the kubelet, kube-controller-manager & kube-api-server configurations as captured below.
“nodeStatusUpdateFrequency” parameter of the kubelet on each of the worker nodes is updated to “20s”
“node-monitor-grace-period” parameter of the kube-controller-manager on each of the master nodes is updated to “2m”
“default-not-ready-toleration-seconds” , “default-unreachable-toleration-seconds” parameters of the kube-api-server present on each of the master nodes are updated to “60s” each.
Simulation of a simple pod creation, Node Unreachability:
A simple nginx pod with the below configuration has been created.
Note: A deployment can also be created here so as to observe a new pod on a new node when the affected pod is terminated due to node unreachability.
[svanka@svanka wlf]$ cat simple-pod.yaml
apiVersion: v1
kind: Pod
metadata:
  name: nginx
spec:
  containers:
  - name: nginx
    image: nginx:1.14.2
    ports:
    - containerPort: 80
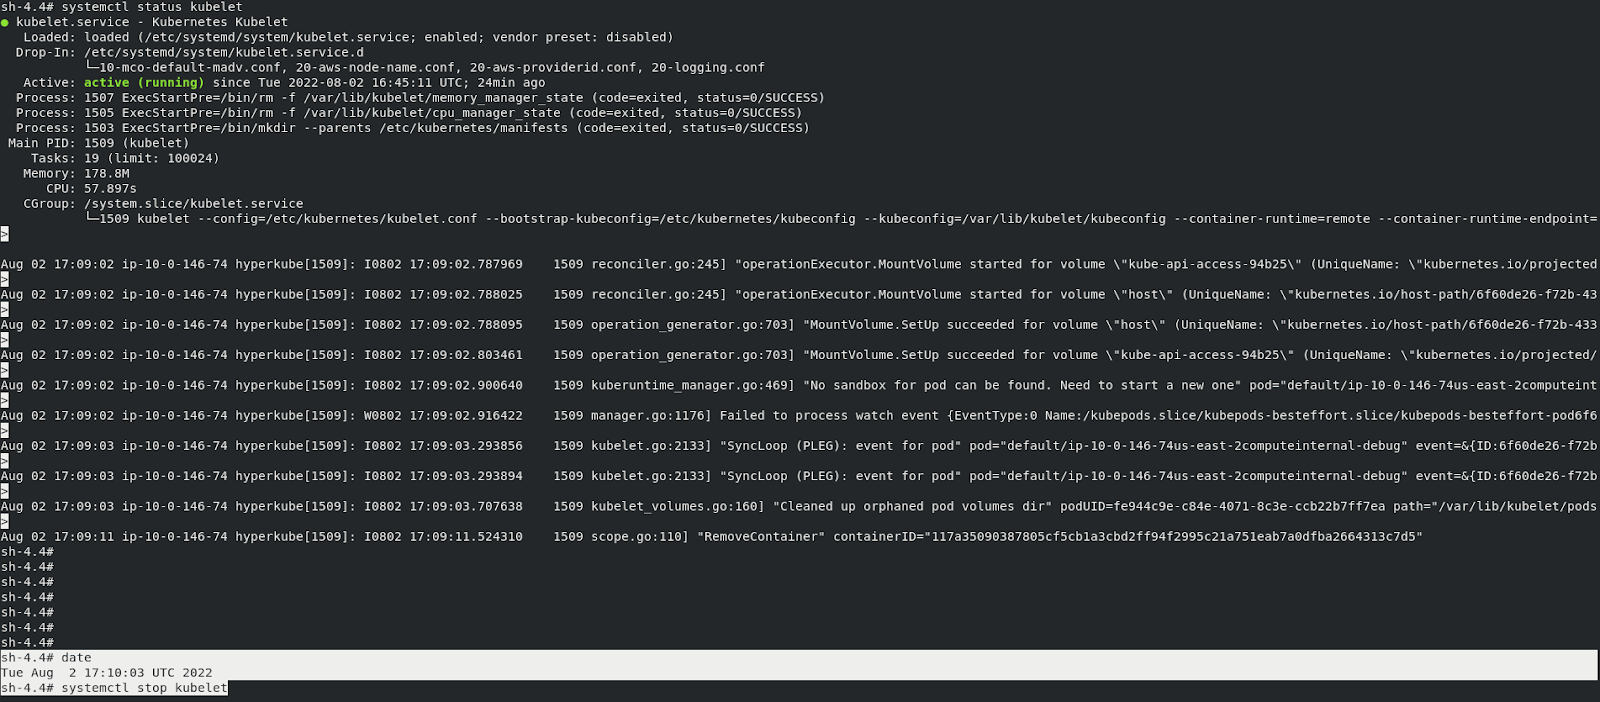
It is observed that the pod is created on a worker node and the kubelet service on that particular worker node has been stopped by making a note of the timestamp as follows.
[svanka@svanka wlf]$ oc get pods -owide
NAME                                           READY   STATUS      RESTARTS   AGE     IP            NODE                                        NOMINATED NODE   READINESS GATES
nginx                                          1/1     Running     0          11m     10.129.2.6    ip-10-0-146-74.us-east-2.compute.internal   <none>           <none>
The events related to the “nginx” are collected and a “NodeNotReady” event is updated by the kube-controller-manager as follows after around “2m” interval, which is the “node-monitor-grace-period”
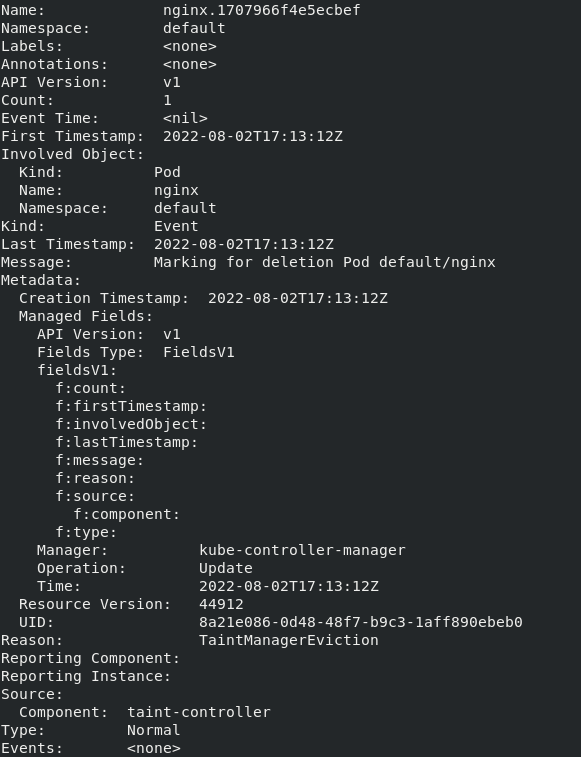
After the “60s” time interval which is the “default-not-ready-toleration-seconds”, the pod has been marked for deletion and entered the “Terminating” state. An event is also observed.
In case of a deployment, a new pod would have been created on another worker node as mentioned in the above note.
Summary
- The pod termination in the case of “MediumUpdateAverage” reaction worker latency profile took around “3m” time interval (node-monitor-grace-period + default-not-ready-toleration-seconds) where as it takes around “5m40s”, “5m60s” in the case of “Default” and “LowUpdateSlowReaction” worker latency profiles respectively.
- We can observe, the Default profile’s reaction time is in between the Medium and the Low profile reaction times.
- The “Default” profile works for most of the cases and depending on the network latencies, high pod densities, high disk i/o, etc. the desired profile can be set.
저자 소개
채널별 검색
오토메이션
기술, 팀, 인프라를 위한 IT 자동화 최신 동향
인공지능
고객이 어디서나 AI 워크로드를 실행할 수 있도록 지원하는 플랫폼 업데이트
오픈 하이브리드 클라우드
하이브리드 클라우드로 더욱 유연한 미래를 구축하는 방법을 알아보세요
보안
환경과 기술 전반에 걸쳐 리스크를 감소하는 방법에 대한 최신 정보
엣지 컴퓨팅
엣지에서의 운영을 단순화하는 플랫폼 업데이트
인프라
세계적으로 인정받은 기업용 Linux 플랫폼에 대한 최신 정보
애플리케이션
복잡한 애플리케이션에 대한 솔루션 더 보기
가상화
온프레미스와 클라우드 환경에서 워크로드를 유연하게 운영하기 위한 엔터프라이즈 가상화의 미래


