Introduction
With the Red Hat Advanced Cluster Management for Kubernetes (RHACM) observability service enabled, you can use RHACM to gain insight and optimize your managed clusters. This information can save cost and prevent unnecessary events.
When RHACM observability is installed, the metrics in managed clusters are collected and uploaded to the hub cluster. The default metrics that are collected are defined in the ConfigMap, observability-metrics-custom-allowlist. There are also predefined Grafana dashboards in RHACM, so that you can observe all the managed clusters from the hub cluster easily.
The previously mentioned default metrics collection and dashboards may not satisfy users. In this blog series, I introduce how to customize your RHACM observability settings. This article introduces how to customize Grafana dashboards. More specifically, I demonstrate how to customize the metrics allowlist and alert rules.
Prerequisites
- You must install Red Hat Advanced Cluster Management for Kubernetes (RHACM)
- You must enable the RHACM observability service
Default grafana dashboards
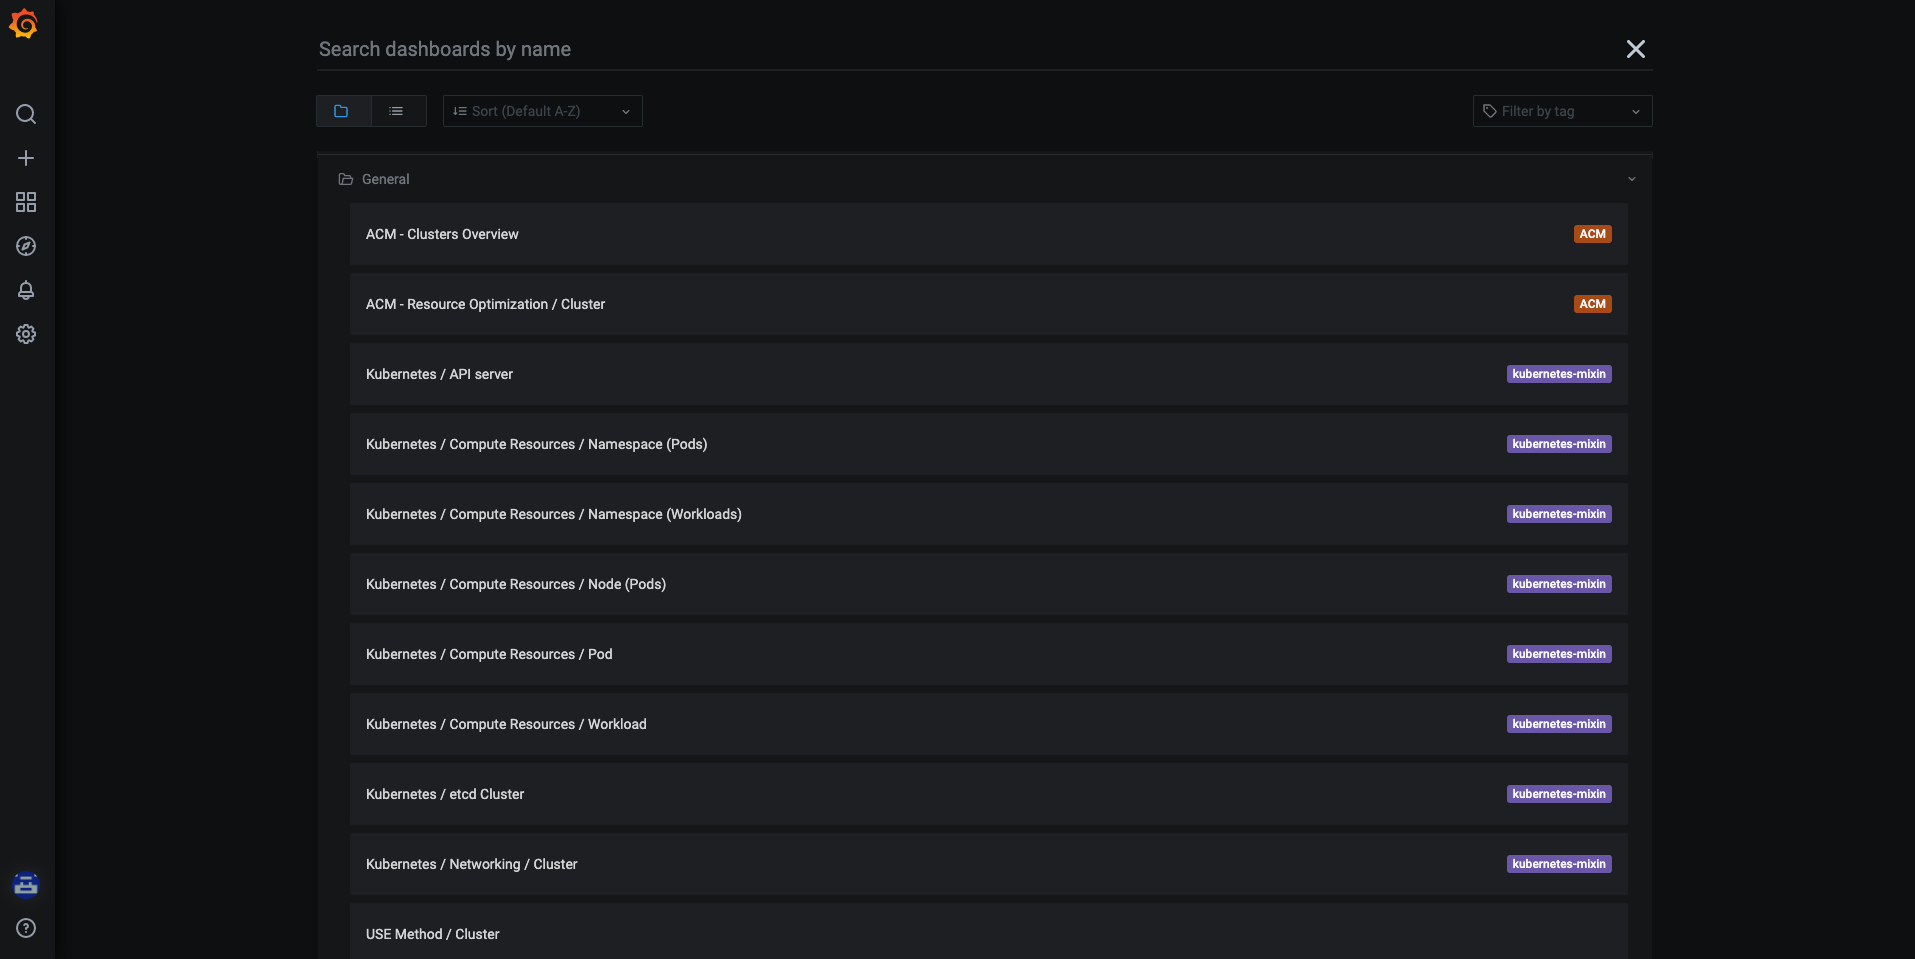
RHACM observability provides the ability to monitor the health of your managed clusters. You can observe and manage clusters through Grafana dashboards. Access the Grafana dashboards through the URL, https://$ACM_URL/grafana. The default Grafana dashboards are shown in the following image. See the source code in multicluster-observability-operator.
Customize the Grafana dashboards
RHACM observability also provides the ability to customize the Grafana dashboards. For example, the default dashboards do not show the average received container bandwidth, so you should add a dashboard and panel to observe that metric. Complete the following steps to design and create your own dashboard:
-
Clone the following repository, multicluster-observability-operator:
git clone git@github.com:open-cluster-management/multicluster-observability-operator.git -
Set up the Grafana developer instance:
cd multicluster-observability-operator/tools
./setup-grafana-dev.sh --deploy -
Switch the user to be a Grafana admin. Navigate to the Grafana URL,
https://$ACM_URL/grafana-dev/and log in. Then run the following command:./switch-to-grafana-admin.sh kube:admin -
Design your Grafana dashboard. For more information, see Design your Grafana dashboard. Complete the following steps to create a dashboard:
-
From the Grafana console, create a dashboard by selecting the Add icon from the navigation panel. Hover your cursor over Create > Dashboard. Then click Add new panel:

-
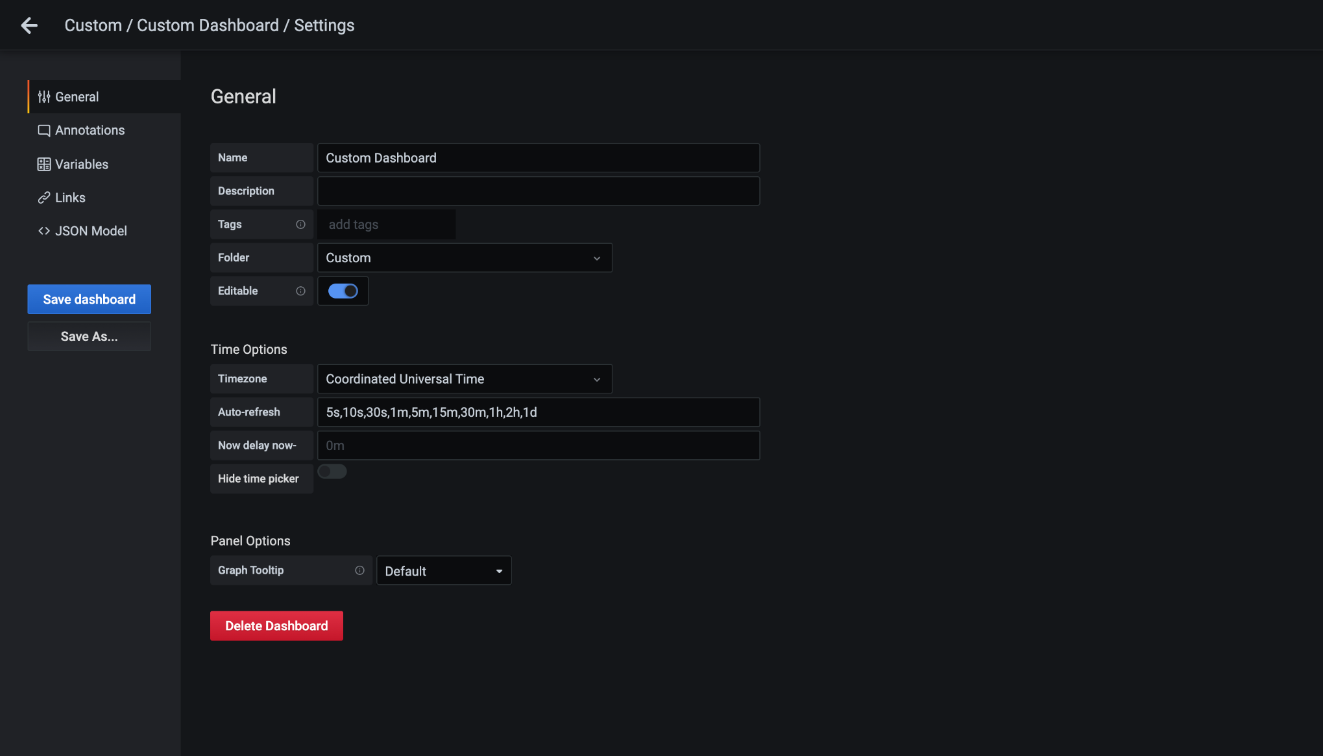
Select the dashboard settings. From the General tab, define the dashboard name as
Custom Dashboard.
-
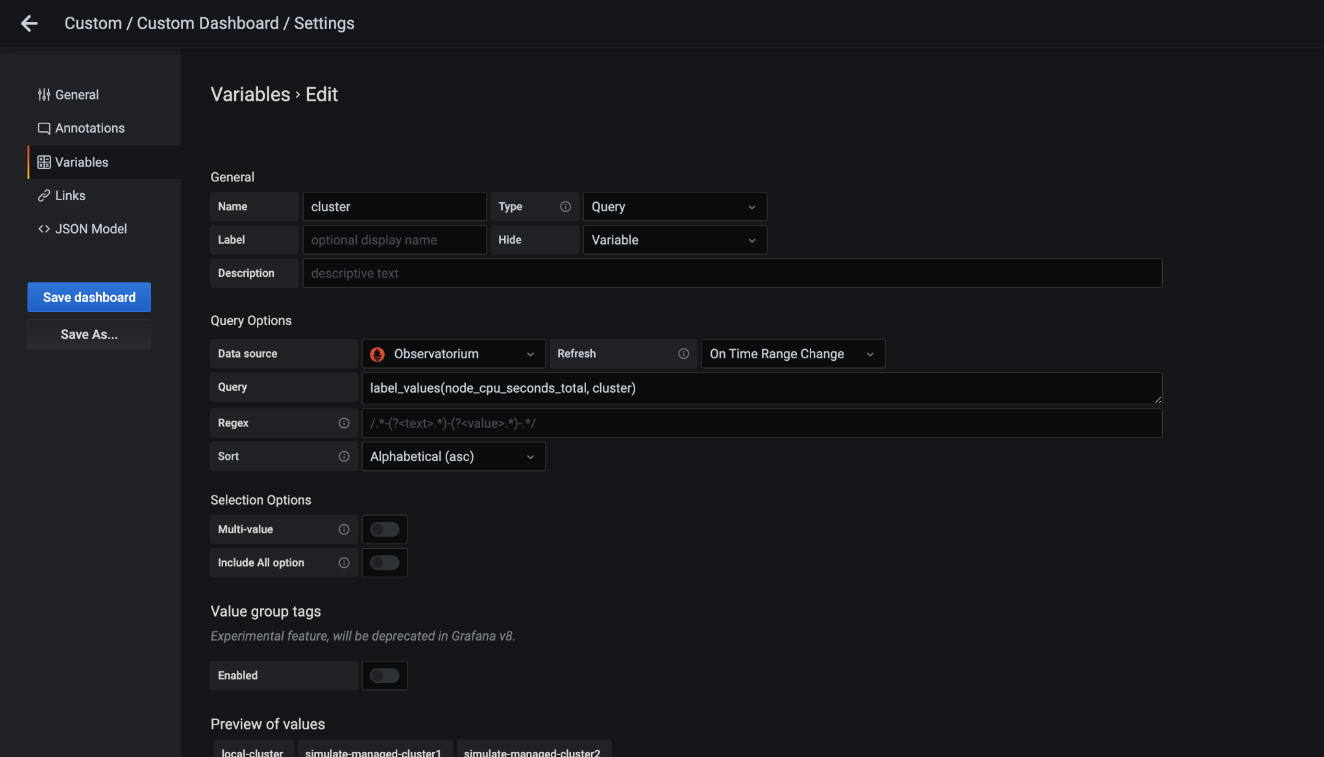
From the Variables tab, add the variable name
datasourceand cluster provider, which is used in the dashboard query. Fill in the table as seen in the following image:

-
From the Custom Dashboard/Edit Panel view, navigate to the Query tab.
-
Configure your query by selecting Observatorium from the data source selector and enter a PromQL query:
avg(irate(container_network_receive_bytes_total{cluster="$cluster", namespace=~".+"}[$__interval])) by (namespace)

-
From the Grafana dashboard header, click the Save icon that is in the dashboard header.
-
Use the
generate-dashboard-configmap-yaml.shscript to generate the dashboard ConfigMap, and to save the ConfigMap locally. Run the following command:# ./generate-dashboard-configmap-yaml.sh "Custom Dashboard"
Save dashboard <custom-dashboard> to ./custom-dashboard.yaml
For more information see, example/custom-dashboard.yaml for an existing custom dashboard.
-
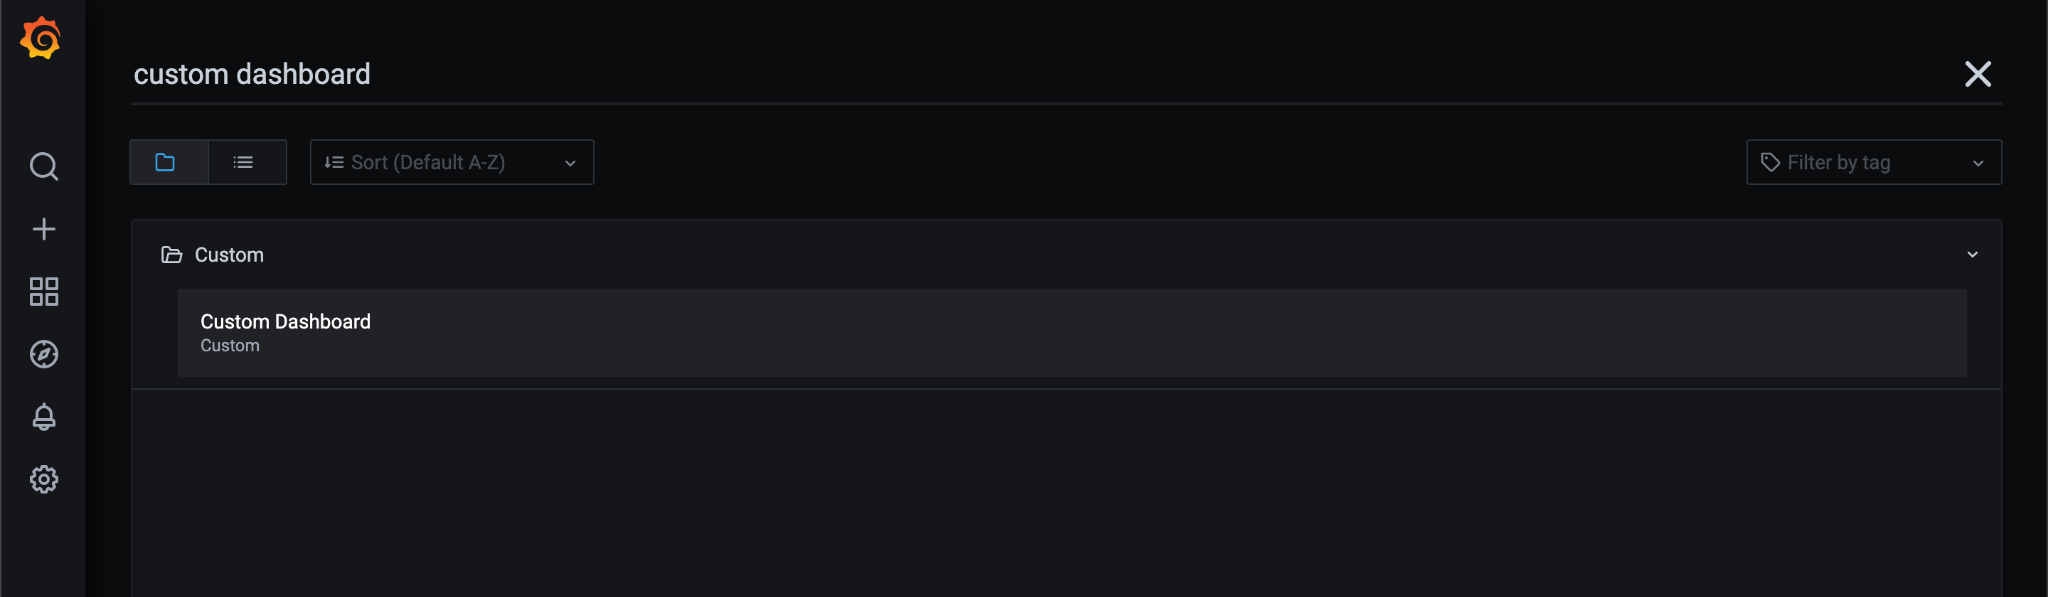
So far, you can search and see a new dashboard named Custom Dashboard as shown in the following image:
Note: You may also see the panel has no data. This happens by default because the only metrics listed in observability-metrics-allowlist are collected by the RHACM observability service. To collect more metrics for your custom dashboard, continue reading or follow Adding custom metrics from the product documentation.
Update the custom metrics allowlist
In this example, let's update the custom metrics allowlist for the example/observability-metrics-custom-allowlist.yaml:
-
Add custom metrics with the following command:
oc create -f example/observability-metrics-custom-allowlist.yaml -
View and explore data by navigating to the Grafana explore page, and search the collected metrics data. Your results might resemble the following image:
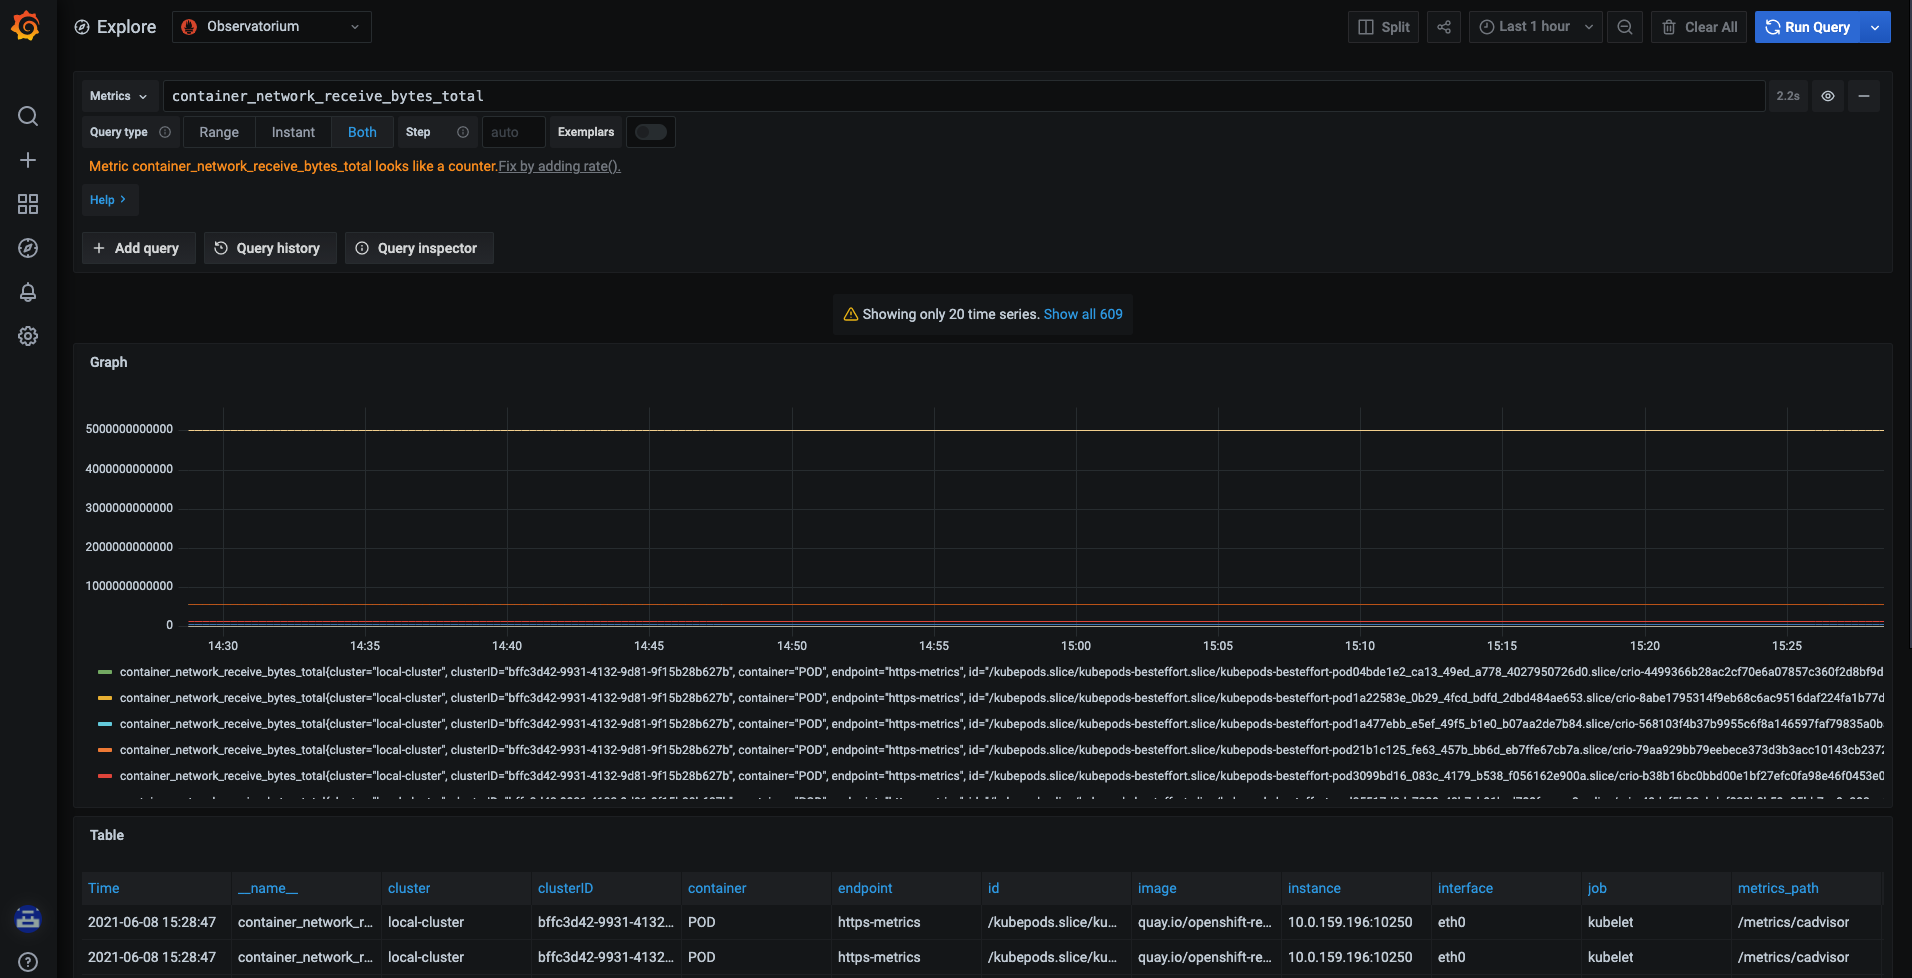
-
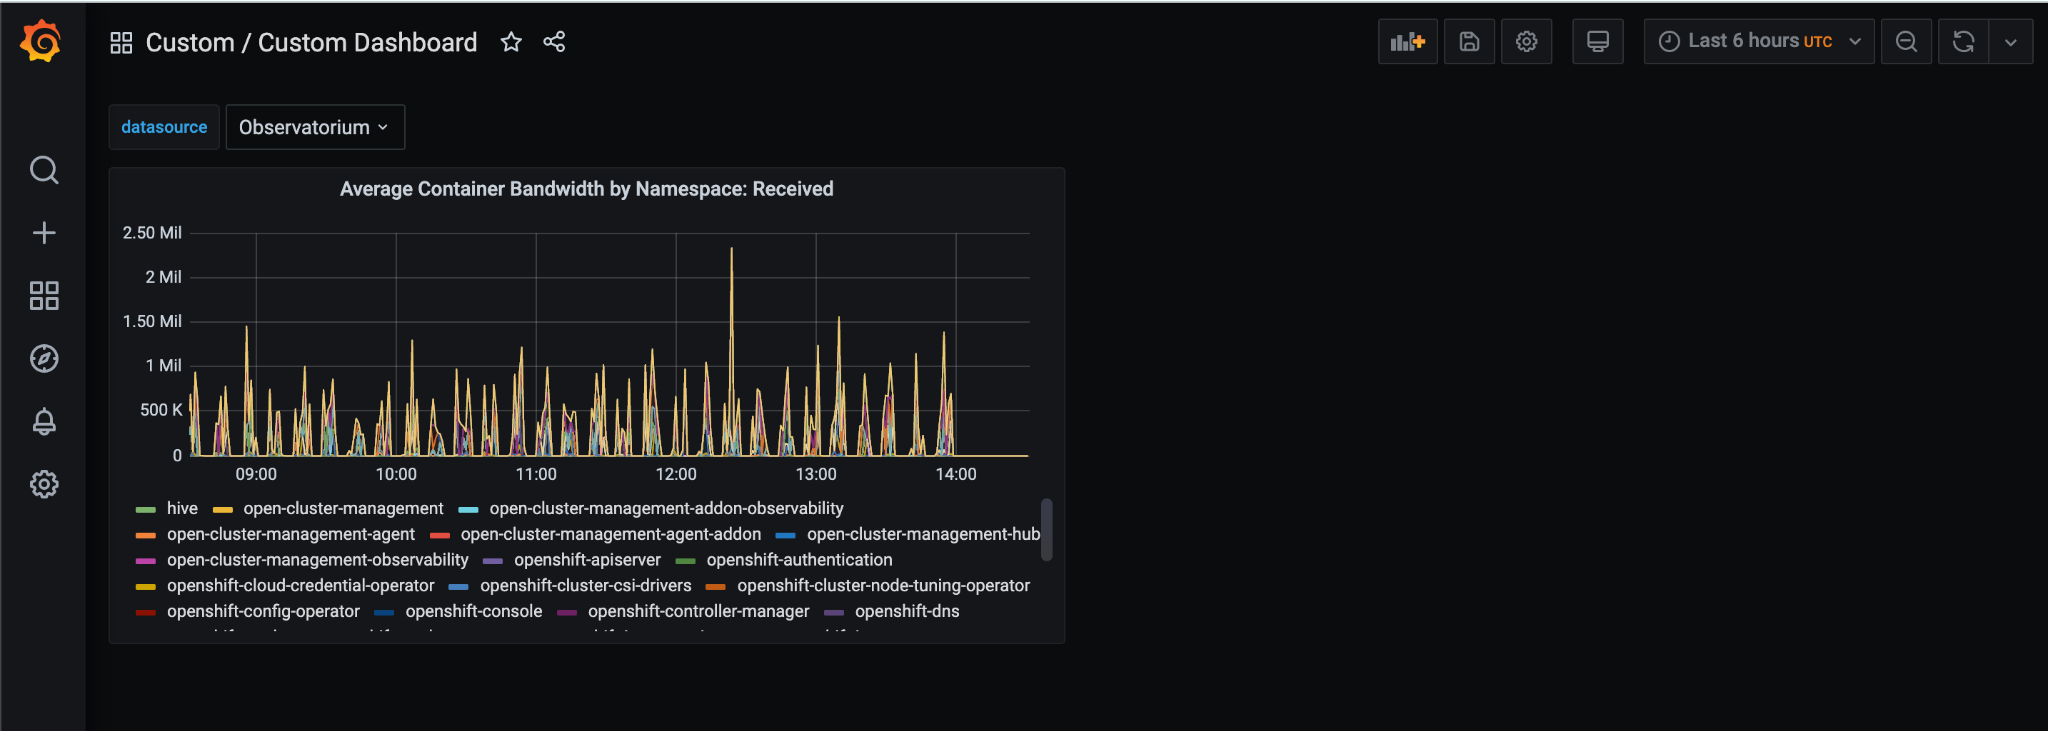
Let's go back to the Custom Dashboard dashboard to see that the data is available in the panel:
Summary
Throughout this blog, I have provided guidance to help you design your Grafana dashboard through the console. Remember to update the metrics allowlist if your dashboard is using a new metrics name. In the next article, I plan to introduce more on how to customize the metrics collection.
저자 소개

유사한 검색 결과
Strengthening the enterprise foundation: Red Hat and Oracle’s expanding collaboration
Hardened, ready, and no cost: Container security evolved
Can Kubernetes Help People Find Love? | Compiler
Scaling For Complexity With Container Adoption | Code Comments
채널별 검색

오토메이션
기술, 팀, 인프라를 위한 IT 자동화 최신 동향

인공지능
고객이 어디서나 AI 워크로드를 실행할 수 있도록 지원하는 플랫폼 업데이트

오픈 하이브리드 클라우드
하이브리드 클라우드로 더욱 유연한 미래를 구축하는 방법을 알아보세요

보안
환경과 기술 전반에 걸쳐 리스크를 감소하는 방법에 대한 최신 정보

엣지 컴퓨팅
엣지에서의 운영을 단순화하는 플랫폼 업데이트

인프라
세계적으로 인정받은 기업용 Linux 플랫폼에 대한 최신 정보

애플리케이션
복잡한 애플리케이션에 대한 솔루션 더 보기
가상화
온프레미스와 클라우드 환경에서 워크로드를 유연하게 운영하기 위한 엔터프라이즈 가상화의 미래