
What is Prometheus? As per the official documentation, Prometheus is an open source system monitoring tool kit based on a time series database. It measures values at a periodic occurrence of time. It was founded at Sound Cloud in the year 2012, but is a standalone open source project and maintained independently of any single company. It was adopted by CNCF in 2016.
What is Prometheus?
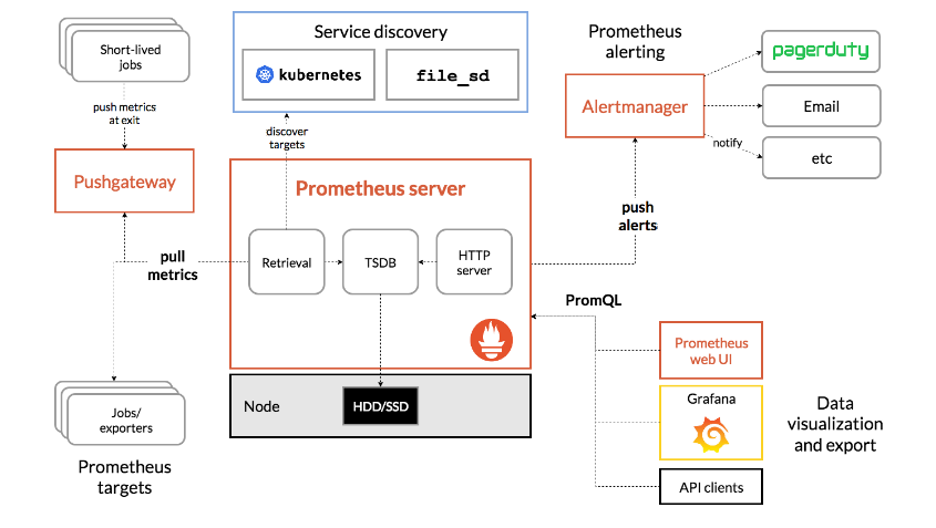
Prometheus is a pull-based monitoring system. Take a look at the above reference architecture. It can be designed to monitor servers, virtual machines, databases, etc. We know it is crucial to monitor these resources periodically. It relies on HTTP calls. For example: If a web server is hosted at http://foo-bar:8080, and exposes metrics at http://foo-bar:8080/metrics, Prometheus pulls the data from the target URL. The most important point to note here is that Prometheus is not an event-based monitoring system, meaning it does not send alerts. Instead, it collects pre-determined metrics about your applications based on rules.
From the diagram, we see that Prometheus collects metrics from pre-configured services or applications and then stores it on a storage disk. The collected data is pushed to its alert management system. From there, it is retrieved for pager use, email, or any other methods.
Data visualization: As seen in the above diagram, you can visualize a target's data using the Prometheus web-ui. It also has a filtering system that allows the user to view custom metrics.
Getting my hands dirty with Prometheus
So, there are two options for getting started with Prometheus:
- Make use of this scenario using Katakoda.
- Follow along by installing minikube on a CentOS 8 machine.
Since it's a hands-on blogpost, I focus on the second method and leave the first method to curious readers.
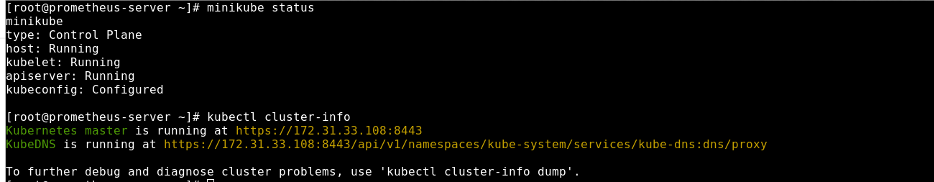
After the minikube is up and running:
Next, enable helm by following the steps below. If you want to brush up on helm basics, please refer to the official help.
$ curl -fsSL -o get_helm.sh https://raw.githubusercontent.com/helm/helm/master/scripts/get-helm-3
$ chmod 700 get_helm.sh
$ ./get_helm.sh
After you enable helm, you just need to install Prometheus using this command:
[root@prometheus-server ~]# helm install prometheus stable/prometheus --namespace monitoring
Error: failed to download "stable/prometheus" (hint: running `helm repo update` may help)
[root@prometheus-server ~]# helm repo add stable https://kubernetes-charts.storage.googleapis.com/
"stable" has been added to your repositories
[root@prometheus-server ~]# helm repo update
Hang tight while we grab the latest from your chart repositories...
...Successfully got an update from the "stable" chart repository
Update Complete. ⎈ Happy Helming!⎈

[root@prometheus-server ~]# helm install prometheus stable/prometheus --namespace default
Now we see that Prometheus is installed on minikube. We list its service information with the following command:
[root@prometheus-server ~]# minikube service list
|-------------|-------------------------------|--------------|-----|
|  NAMESPACE  |             NAME              | TARGET PORT  | URL |
|-------------|-------------------------------|--------------|-----|
| default     | kubernetes                    | No node port |
| default     | prometheus-alertmanager       | No node port |
| default     | prometheus-kube-state-metrics | No node port |
| default     | prometheus-node-exporter      | No node port |
| default     | prometheus-pushgateway        | No node port |
| default     | prometheus-server             | No node port |
| kube-system | kube-dns                      | No node port |
| kube-system | metrics-server                | No node port |
What's next?
This article covers the basic concepts of Prometheus as well as installation on minikube. I will cover applications monitoring in the next article, so be sure to keep an eye out for that.
More resources:
- The Official Prometheus Website
- Prometheus Monitoring: The Definitive Guide
- How to Set Up Prometheus and Ingress on Kubernetes
[ Free cheat sheet: Kubernetes glossary ]
저자 소개
I work as a Solutions Engineer at Red Hat and my day-to-day work involves OpenShift and Ansible. I'm highly passionate about open source software, cloud, security, and networking technologies.
유사한 검색 결과
강력한 보안, 즉시 사용 가능, 추가 비용 없이 제공: 컨테이너 보안의 진화
Ansible Automation Platform 2.6 업그레이드 경로 계획
Operating System Management | Compiler
Technically Speaking | Taming AI agents with observability
채널별 검색

오토메이션
기술, 팀, 인프라를 위한 IT 자동화 최신 동향

인공지능
고객이 어디서나 AI 워크로드를 실행할 수 있도록 지원하는 플랫폼 업데이트

오픈 하이브리드 클라우드
하이브리드 클라우드로 더욱 유연한 미래를 구축하는 방법을 알아보세요

보안
환경과 기술 전반에 걸쳐 리스크를 감소하는 방법에 대한 최신 정보

엣지 컴퓨팅
엣지에서의 운영을 단순화하는 플랫폼 업데이트

인프라
세계적으로 인정받은 기업용 Linux 플랫폼에 대한 최신 정보

애플리케이션
복잡한 애플리케이션에 대한 솔루션 더 보기
가상화
온프레미스와 클라우드 환경에서 워크로드를 유연하게 운영하기 위한 엔터프라이즈 가상화의 미래