
The top utility is a commonly used tool for displaying system-performance information. It dynamically shows administrators which processes are consuming processor and memory resources. Top is incredibly handy.
While most administrators quickly grasp the lower portion of top's output, the upper part is harder to interpret. So this article explains the five lines displayed at the top of top:
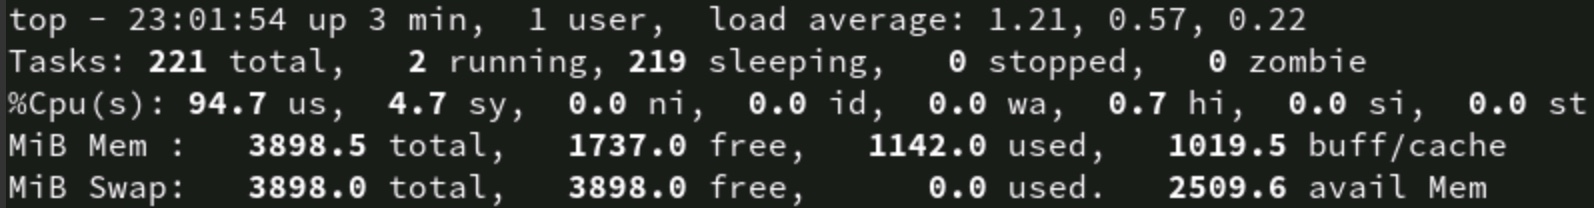
topdisplays uptime informationTasksdisplays process status information%Cpu(s)displays various processor valuesMiB Memdisplays physical memory utilizationMiB Swapdisplays virtual memory utilization
Uptime
Top's first line, top, shows the same information as the uptime command. The first value is the system time. The second value represents how long the system has been up and running, while the third value indicates the current number of users on the system. The final values are the load average for the system.
The load average is broken down into three time increments. The first shows the load for the last one minute, the second for the last five minutes, and the final value for the last 15 minutes. The results are a percentage of CPU load between 0 and 1.0. The processor is likely overworked if 1.0 (or higher) is displayed.
top - 23:03:09 up 4 min, 1 user, load average: 0.75, 0.59, 0.25
[ Get The Automated Enterprise eBook to learn more aboutthe important role IT automation plays in business today. ]
Tasks
The second line is the Tasks output, and it's broken down into five states. These five states display the status of processes on the system:
totalshows the sum of the processes from any state.runningshows how many processes are handling requests, executing normally, and have CPU access.sleepingindicates processes awaiting resources, which is a normal state.stoppedreports processes exiting and releasing resources; these send a termination message to the parent process.zombierefers to a process waiting for its parent process to release it; it may become orphaned if the parent exits first.
Zombie processes usually mean an application or service didn't exit gracefully. A few zombie processes on a long-running system are not usually a problem.
Tasks: 220 total, 3 running, 217 sleeping, 0 stopped, 0 zombie
%Cpu(s)
Values related to processor utilization are displayed on the third line. They provide insight into exactly what the CPUs are doing.
usis the percent of time spent running user processes.syis the percent of time spent running the kernel.niis the percent of time spent running processes with manually configured nice values.idis the percent of time idle (if low, CPU may be overworked).wais the percent of wait time (if high, CPU is waiting for I/O access).hiis the percent of time managing hardware interrupts.siis the percent of time managing software interrupts.stis the percent of virtual CPU time waiting for access to physical CPU.
Values such as id, wa, and st help identify whether the system is overworked.
%Cpu(s): 19.3 us, 4.0 sy, 0.0 ni, 74.7 id, 0.0 wa, 0.3 hi, 1.7 si, 0.0 st
MiB Memory
The final two lines of top's output provide information on memory utilization. The first line—MiB Mem—displays physical memory utilization. This value is based on the total amount of physical RAM installed on the system.
MiB Mem: 3898.5 total, 385.2 free, 1167.0 used, 2346.2 buff/cache
Note: The term mebibyte (and similar units, such as kibibytes and gibibytes) differs slightly from measurements such as megabytes. Mebibytes are based on 1024 units, and megabytes are based on 1000 units (decimal). Most users are familiar with the decimal measurement, but it is not as accurate as the binary form. The top utility reports memory consumption in decimal.
totalshows total installed memory.freeshows available memory.usedshows consumed memory.buff/cacheshows the amount of information buffered to be written.
MiB Swap
Linux can take advantage of virtual memory when physical memory space is consumed by borrowing storage space from storage disks. The process of swapping data back and forth between physical RAM and storage drives is time-consuming and uses system resources, so it's best to minimize the use of virtual memory.
MiB Swap: 3898.0 total, 3898.0 free, 0.0 used, 2433.1 avail Mem
totalshows total swap space.freeshows available swap space.usedshows consumed swap space.buff/cacheshows the amount of information cached for future reads.
In general, a high amount of swap utilization indicates the system does not have enough memory installed for its tasks. The solution is to either increase RAM or decrease the workload.
Wrap up
Glancing at the bottom 75% of top's output gives you a sense of what processes are consuming the most resources on the system. This information is often sufficient for many needs. However, the upper portion of top's output allows you to delve more deeply into exactly how the system is performing and whether CPU or RAM (or both) are utilized effectively.
저자 소개
Damon Garn owns Cogspinner Coaction, LLC, a technical writing, editing, and IT project company based in Colorado Springs, CO. Damon authored many CompTIA Official Instructor and Student Guides (Linux+, Cloud+, Cloud Essentials+, Server+) and developed a broad library of interactive, scored labs. He regularly contributes to Enable Sysadmin, SearchNetworking, and CompTIA article repositories. Damon has 20 years of experience as a technical trainer covering Linux, Windows Server, and security content. He is a former sysadmin for US Figure Skating. He lives in Colorado Springs with his family and is a writer, musician, and amateur genealogist.
유사한 검색 결과
Red Hat Enterprise Linux, 양자 컴퓨팅 시대를 대비한 SSH 보안 역량 강화
Red Hat Device Edge, 이제 NVIDIA Jetson Orin에서 사용 가능
Untangling Networks | Compiler
Infrastructure At The Edge | Compiler
채널별 검색

오토메이션
기술, 팀, 인프라를 위한 IT 자동화 최신 동향

인공지능
고객이 어디서나 AI 워크로드를 실행할 수 있도록 지원하는 플랫폼 업데이트

오픈 하이브리드 클라우드
하이브리드 클라우드로 더욱 유연한 미래를 구축하는 방법을 알아보세요

보안
환경과 기술 전반에 걸쳐 리스크를 감소하는 방법에 대한 최신 정보

엣지 컴퓨팅
엣지에서의 운영을 단순화하는 플랫폼 업데이트

인프라
세계적으로 인정받은 기업용 Linux 플랫폼에 대한 최신 정보

애플리케이션
복잡한 애플리케이션에 대한 솔루션 더 보기
가상화
온프레미스와 클라우드 환경에서 워크로드를 유연하게 운영하기 위한 엔터프라이즈 가상화의 미래