
In this article, I will demonstrate how to monitor Ansible Automation Platform(AAP) running on OpenShift, using user-workload-monitoring with Prometheus and Grafana.
This article uses the following versions:
- OpenShift v4.13.1
- Grafana Operator v5.4.1
- Ansible Automation Platform v2.4
I won't cover the installation of the Ansible Automation Platform here.
About this article
This article is aimed at users who want a more centralized view of the main usage metrics of the Ansible Automation Platform and identify possible situations of concern. It covers resources such as Grafana, datasources, dashboards, Prometheus, and ServiceMonitors to collect data dynamically.
Prerequisites
- User with the cluster-admin cluster role
- OpenShift 4.12 or +
- Grafana Operator
- User-Defined Projects enabled
Procedure
Use the following steps to begin monitoring Ansible Automation Platform(AAP) using Prometheus and Grafana.
Enable user-defined projects
Execute this command to add `enableUserWorkload: true` under `data/config.yaml`:
$ oc -n openshift-monitoring patch configmap cluster-monitoring-config -p '{"data":{"config.yaml":"enableUserWorkload: true"}}'
`Validate that the prometheus and thanos-ruler pods were created in the openshift-user-workload-monitoring project:
$ oc get pods -n openshift-user-workload-monitoring
NAME READY STATUS RESTARTS AGE
grafana-deployment-6847648746-4mbn9 1/1 Running 0 95m
grafana-operator-controller-manager-7f74d54f44-58pwk 1/1 Running 0 6h55m
prometheus-operator-cf59f9bdc-t7nvm 2/2 Running 0 7h6m
prometheus-user-workload-0 6/6 Running 0 7h6m
prometheus-user-workload-1 6/6 Running 0 7h6m
thanos-ruler-user-workload-0 4/4 Running 0 7h6m
thanos-ruler-user-workload-1 4/4 Running 0 7h6m
Install Grafana Operator
Using the WebConsole, in the left side menu, select OperatorHub, then search for Grafana Operator in the search field.
Make sure to change the project context to openshift-user-workload-monitoring at the top.
Click on the operator and click on Install.

Use the following settings:
- In Update Channel, select v5.
- In Installation Mode, select A specific namespace on the cluster and choose openshift-user-workload-monitoring below.
- In Update approval, select Automatic.
- Click Install.

Now, create a service account and assign permission to read metrics. Use the following commands:
$ oc project openshift-user-workload-monitoring

$ oc create sa grafana-sa

$ oc adm policy add-cluster-role-to-user cluster-monitoring-view -z grafana-sa
Collect the grafana-sa serviceaccount token and create a secret for the Grafana instance:
$ SECRET=`oc -n openshift-user-workload-monitoring describe sa grafana-sa | awk '/Tokens/{ print $2 }'`

$ TOKEN=`oc -n openshift-user-workload-monitoring get secret $SECRET --template='{{ .data.token | base64decode }}'`

$ cat <<EOF > grafana-secret-creds.yaml
kind: Secret
apiVersion: v1
metadata:
  name: credentials
  namespace: openshift-user-workload-monitoring
stringData:
  GF_SECURITY_ADMIN_PASSWORD: grafana <------ Set the password you want to authenticate with Grafana
  GF_SECURITY_ADMIN_USER: root <------ Set the desired user to authenticate in Grafana
  PROMETHEUS_TOKEN: '${TOKEN}' <------ This variable will receive the token collected above
type: Opaque
EOF

$ oc create -f grafana-secret-creds.yaml
Next, create the Grafana instance. It will read the credentials defined in the previously created secret, as seen below:
$ cat <<EOF > grafana-instance.yaml
apiVersion: grafana.integreatly.org/v1beta1
kind: Grafana
metadata:
  name: grafana
  labels:
    dashboards: "grafana"
    folders: "grafana"
spec:
  deployment:
    spec:
      template:
        spec:
          containers:
            - name: grafana
              env:
                - name: GF_SECURITY_ADMIN_USER
                  valueFrom:
                    secretKeyRef:
                      key: GF_SECURITY_ADMIN_USER
                      name: credentials
                - name: GF_SECURITY_ADMIN_PASSWORD
                  valueFrom:
                    secretKeyRef:
                      key: GF_SECURITY_ADMIN_PASSWORD
                      name: credentials
  config:
    auth:
      disable_login_form: "false"
      disable_signout_menu: "true"
    auth.anonymous:
      enabled: "false"
    log:
      level: warn
      mode: console
EOF
Apply and validate the created Instance:
$ oc -n openshift-user-workload-monitoring create -f grafana-instance.yaml

$ oc -n openshift-user-workload-monitoring get pods -l app=grafana
NAME READY STATUS RESTARTS AGE
grafana-deployment-c4959687c-7vg9d 1/1 Running 0 6m24s
Expose the grafana service using an edge-type route. Use the service called grafana-service. Here's an example:
$ oc -n openshift-user-workload-monitoring get svc
NAME TYPE CLUSTER-IP EXTERNAL-IP PORT(S) AGE
grafana-operator-operator-metrics-service ClusterIP 172.30.37.111 <none> 8443/TCP 7h1m
grafana-service ClusterIP 172.30.244.194 <none> 3000/TCP 6h16m
prometheus-operated ClusterIP None <none> 9090/TCP,10901/TCP 7h12m
prometheus-operator ClusterIP None <none> 8443/TCP 7h12m
prometheus-user-workload ClusterIP 172.30.159.129 <none> 9091/TCP,9092/TCP,10902/TCP 7h12m
prometheus-user-workload-thanos-sidecar ClusterIP None <none> 10902/TCP 7h12m
thanos-ruler ClusterIP 172.30.213.131 <none> 9091/TCP,9092/TCP,10901/TCP 7h12m
thanos-ruler-operated ClusterIP None <none> 10902/TCP,10901/TCP 7h12m

$ oc -n openshift-user-workload-monitoring create route edge grafana --service=grafana-service --insecure-policy=Redirect
Display the route exposed to Grafana:
$ oc -n openshift-user-workload-monitoring get route grafana -o jsonpath='{.spec.host}'
It's time to create the Grafana Datasource, which will connect to thanos-querier in the openshift-monitoring project and will use the grafana-sa serviceaccount token that is stored in secret credentials.
$ cat <<EOF > grafana-datasource.yaml
apiVersion: grafana.integreatly.org/v1beta1
kind: GrafanaDatasource
metadata:
  name: grafana-ds
  namespace: openshift-user-workload-monitoring
spec:
  valuesFrom:
    - targetPath: "secureJsonData.httpHeaderValue1"
      valueFrom:
        secretKeyRef:
          name: "credentials"
          key: "PROMETHEUS_TOKEN"
  instanceSelector:
    matchLabels:
      dashboards: "grafana"
  datasource:
    name: Prometheus
    type: prometheus
    access: proxy
    url: https://thanos-querier.openshift-monitoring.svc:9091
    isDefault: true
    jsonData:
      "tlsSkipVerify": true
      "timeInterval": "5s"
      httpHeaderName1: 'Authorization'
    secureJsonData:
      "httpHeaderValue1": "Bearer ${PROMETHEUS_TOKEN}"
    editable: true
EOF
Apply and validate the created Datasource:
$ oc -n openshift-user-workload-monitoring create -f grafana-datasource.yaml

$ oc -n openshift-user-workload-monitoring get GrafanaDatasource
NAME NO MATCHING INSTANCES LAST RESYNC AGE
grafana-ds 119s 3d23h
To validate the created datasource using Grafana Console, use the edge route created previously and access it via a browser. Authenticate using the username and password added in secret credentials.
Once authenticated, click Configuration > Data sources.

Creating User in Ansible Automation Platform
Access the AAP console and create a user for monitoring. Click on Users > Add in the left side menu to do this.

To generate the token, authenticate to AAP using the created user and then click on Users > select the name of the created user > Token > Add.
Define a description and scope as read and click Save. A popup will be displayed with the token; copy and save it.

Creating Prometheus ServiceMonitor
Create a ServiceMonitor to collect metrics from AAP and export them through the Prometheus and Thanos Querier.
First, create a secret to store the bearer token previously collected in AAP with the user aap-metrics. Here is the command:
$ oc create secret generic aap-monitor-creds --from-literal=token={{ YOUR AAP BEARER TOKEN }} -n aap
Next, create ServiceMonitor, which will discover the AAP service and collect the metrics in the path /api/v2/metrics.
$ cat <<EOF > svc-monitor-aap.yaml
apiVersion: monitoring.coreos.com/v1
kind: ServiceMonitor
metadata:
  name: aap-monitor
  namespace: aap
spec:
  endpoints:
  - interval: 30s
    scrapeTimeout: 10s
    honor_labels: true
    path: /api/v2/metrics/
    port: http
    scheme: http
    bearerTokenSecret:
      key: token
      name: aap-monitor-creds <------ Secret previously created with our Bearer Token
  namespaceSelector:
    matchNames:
    - aap
  selector:
    matchLabels:
      app.kubernetes.io/component: automationcontroller
EOF
Finally, apply and validate the created ServiceMonitor using the following two commands:
$ oc create -f svc-monitor-aap.yaml

$ oc get servicemonitor -n aap
NAME AGE
aap-monitor 31m
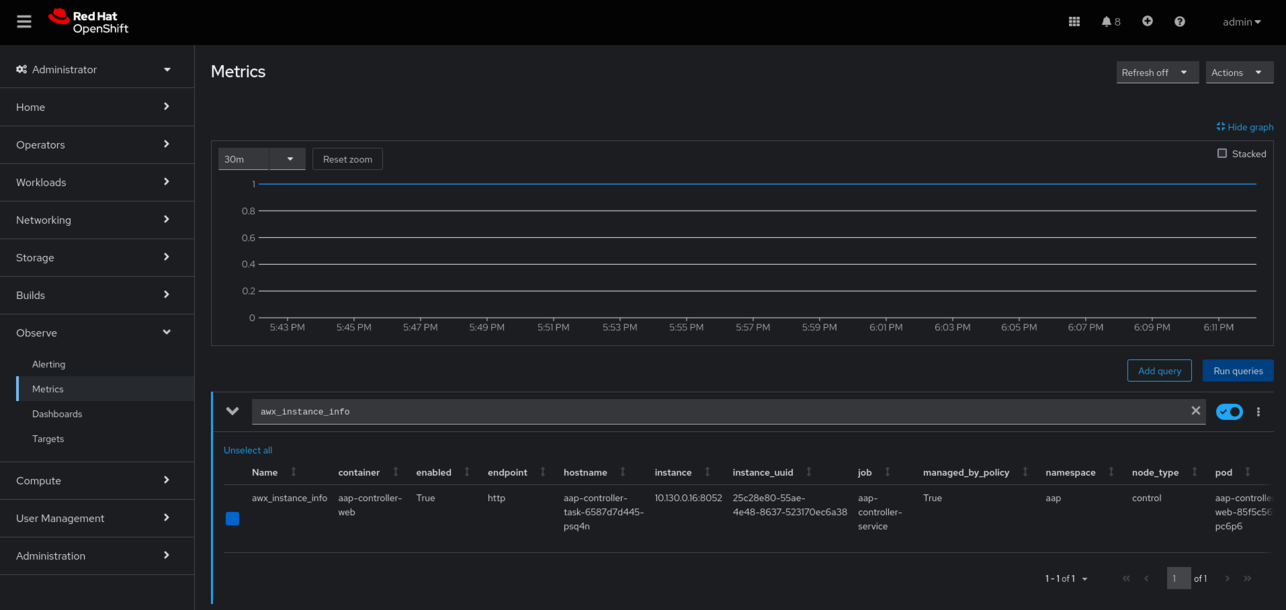
To validate using the WebConsole, in the left side menu, click on Targets in the Observe Session, and in Filter, select User.

While still in the Observe section, click on Metrics. You will identify whether the AAP metrics are arriving correctly. Use any metric starting with awx_, such as awx_instance_info.
Creating Grafana Dashboard
Create a Grafana dashboard, which will fetch the JSON externally from GitHub.
$ cat <<EOF > grafana-dashboard-aap.yaml
apiVersion: grafana.integreatly.org/v1beta1
kind: GrafanaDashboard
metadata:
  name: grafana-dashboard-aap
  labels:
    app: grafana
spec:
  instanceSelector:
    matchLabels:
      dashboards: grafana
  folder: "AAP"
url: https://raw.githubusercontent.com/leoaaraujo/aap-dashboard/main/aap-dash.json
EOF
Next, apply and validate the created Grafana dashboard:
$ oc -n openshift-user-workload-monitoring create -f grafana-dashboard-aap.yaml

$ oc -n openshift-user-workload-monitoring get grafanadashboard
NAME NO MATCHING INSTANCES LAST RESYNC AGE
grafana-dashboard-aap 3s 145m
Viewing the Dashboard
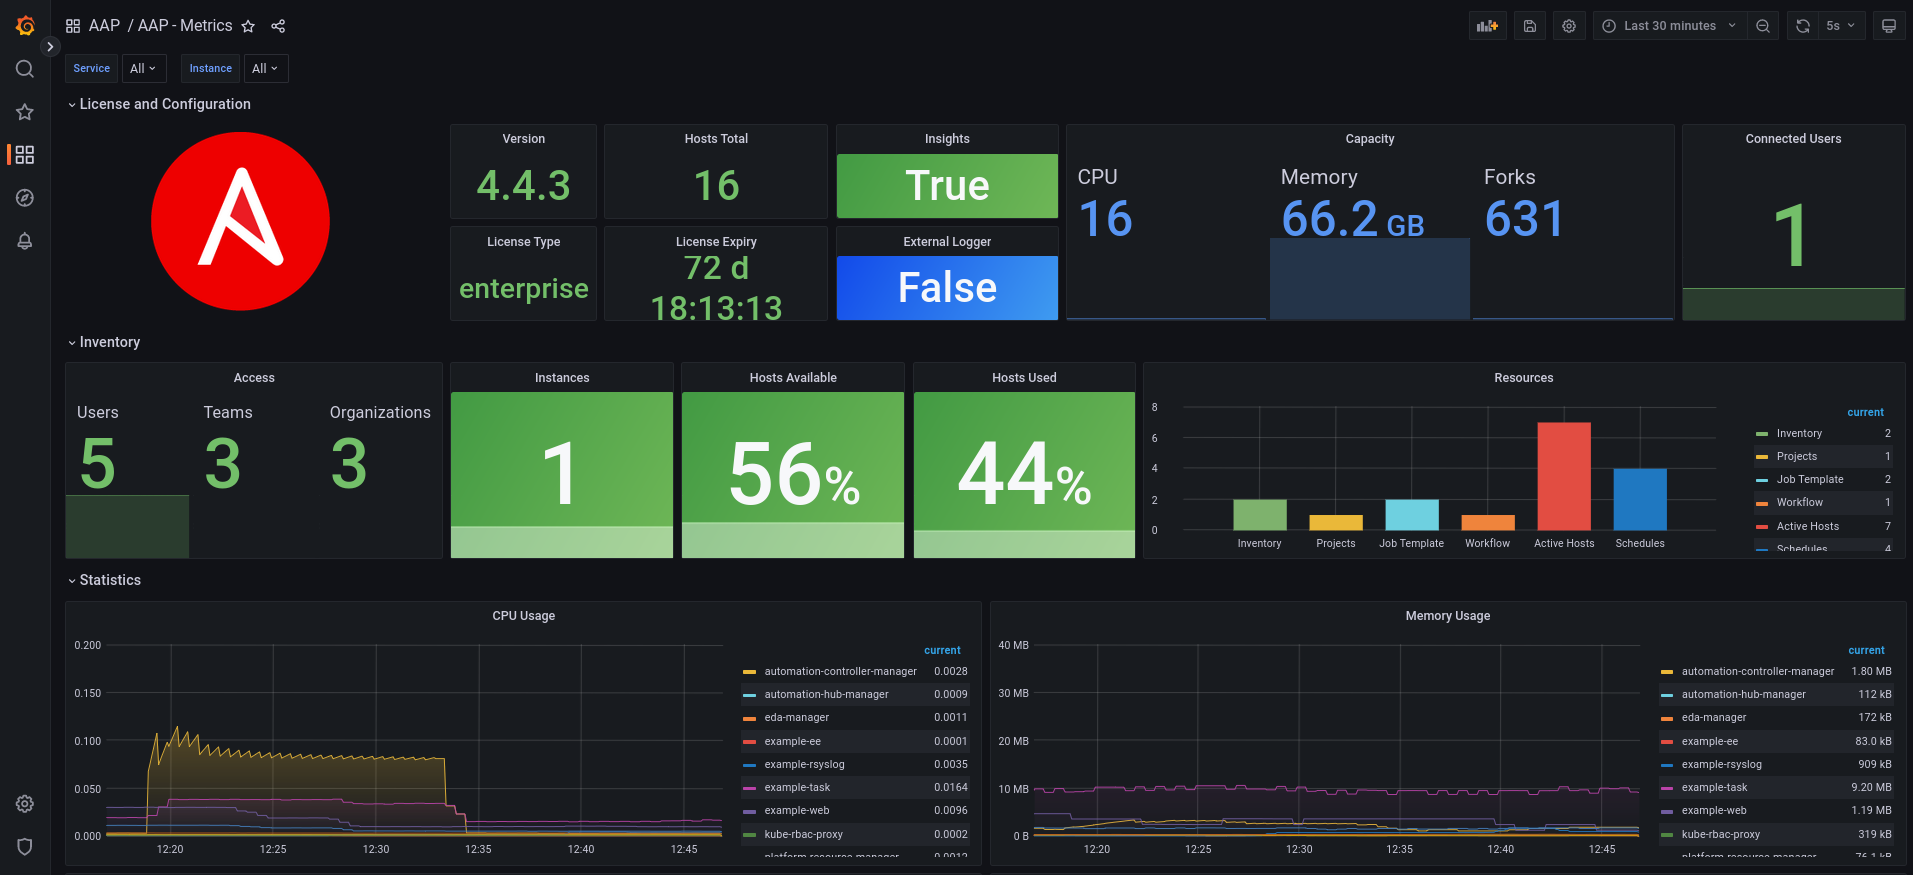
Access Grafana, and in the left side menu, click on Dashboards and then on Browse.
It will display a folder named AAP and the dashboard AAP - Metrics. Click on the dashboard.

The dashboard looks like this:

Wrap up
I demonstrated creating monitoring for the Ansible Automation Platform using User-Defined Projects from the OpenShift Monitoring stack. I used a Grafana Dashboard to visualize usage metrics and statistics, such as subscription information, playbook metrics, users, and resource consumption within OpenShift.
References
For more details and other configurations, start with the reference documents below:
저자 소개
유사한 검색 결과
과거의 운영 방식에서 벗어나 IT의 미래 구축
AI의 다음 변곡점: 에이전트를 엔터프라이즈 슈퍼유저로 전환
Crack the Cloud_Open | Command Line Heroes
Edge computing covered and diced | Technically Speaking
채널별 검색

오토메이션
기술, 팀, 인프라를 위한 IT 자동화 최신 동향

인공지능
고객이 어디서나 AI 워크로드를 실행할 수 있도록 지원하는 플랫폼 업데이트

오픈 하이브리드 클라우드
하이브리드 클라우드로 더욱 유연한 미래를 구축하는 방법을 알아보세요

보안
환경과 기술 전반에 걸쳐 리스크를 감소하는 방법에 대한 최신 정보

엣지 컴퓨팅
엣지에서의 운영을 단순화하는 플랫폼 업데이트

인프라
세계적으로 인정받은 기업용 Linux 플랫폼에 대한 최신 정보

애플리케이션
복잡한 애플리케이션에 대한 솔루션 더 보기
가상화
온프레미스와 클라우드 환경에서 워크로드를 유연하게 운영하기 위한 엔터프라이즈 가상화의 미래