Most system administrators have experienced some kind of abrupt, unknown failure with technology and wished they had a way to predict (and possibly prevent) these kinds of issues from happening—especially when it could otherwise mean late-night calls, paperwork explaining outages, and complicated remediation plans.
The ability to see the overall health of a system or a whole fleet can mean the difference between constantly reacting to problems and proactively preparing for issues before they get out of hand. It can also provide valuable insight into historical patterns or trends that can influence planning for future upgrades or changes to the architecture.
When you start looking at options for building this kind of visibility into your environments, the options can be overwhelming. I'll cover some of the most popular choices in monitoring solutions and why you might be interested in one over another.
If you take a 10,000-foot view of what it means to monitor infrastructure, you can see a few major components that come together to make a functional system.
What to monitor
First, you need something to observe. Most of your monitoring needs will center around the infrastructure you are responsible for, but it can be quite useful to monitor things outside of your infrastructure to help add information to your overall collection.
Specifically, it can be useful to routinely check connectivity into or out of your infrastructure and the outside world. For example, your internal systems may all be working fine, but users complain that they can't reach an important internal website. This could be something as simple as a firewall misconfiguration, which can be tested by running inbound connectivity checks from a cloud provider or a home internet connection. Or maybe developers are stuck in their tracks because they aren't able to pull down copies of specific libraries that they need.
Your network may be fine, but monitoring the upstream projects to at least see when problems arise can be the difference between spending a few moments verifying that it's outside of your network or hours troubleshooting why nobody can get to a third-party website that was suddenly shut down.
Your infrastructure relies on a lot of the outside world functioning normally, so it can be truly insightful to know when those services are having problems.
Connectivity monitoring
A good example of a baby step into monitoring is checking connectivity to the outside world through the network uplinks. Being able to determine the overall health of your inbound and outbound connectivity can save a lot of troubleshooting time when dealing with an outage or fighting a confusing issue.
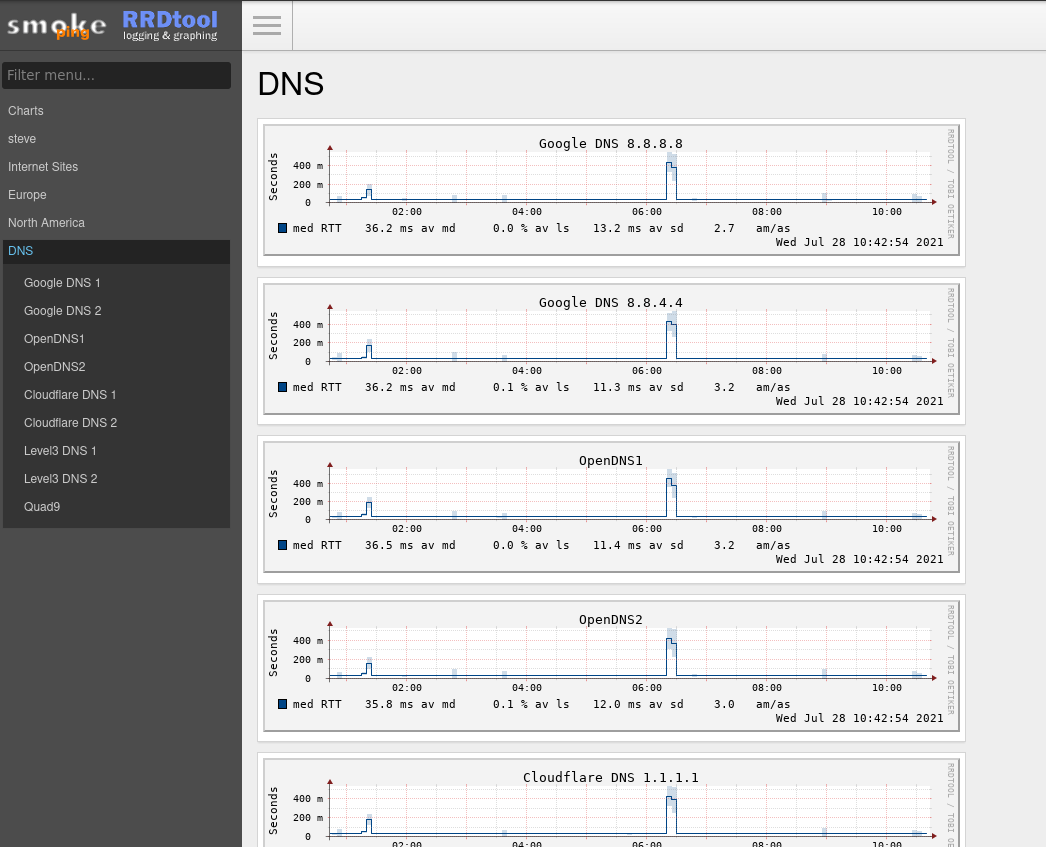
SmokePing is an open source tool designed just for this type of testing. It routinely tests the ability to reach a configurable list of sites and reports the latency for each. It can test using Internet Control Message Protocol (ICMP) pings, but also DNS, SSH, curl, and more. This means you could build multiple tests that reach out to the same destination using different protocols to help paint a broad picture of the health of multiple services running on a single host.
[ Download the network automation for everyone eBook to plan your path to modern network management. ]
SmokePing also generates graphs of the latency it records for these targets and presents them in an intuitive web user interface (UI).

Setting up SmokePing to get a basic view into the overall connectivity of a site or network can be a quick and easy win to bolster your monitoring capabilities. There are even premade container images available that you can modify through their configuration files to suit your needs.
Network monitoring
Beyond simple connectivity monitoring, things can feel a little daunting. Deciding to add other tools (or to trade SmokePing for something more robust) depends entirely on your infrastructure and organization. Many monitoring tools have a particular focus, even when they can provide visibility into other aspects of infrastructure. For example, many monitoring tools are geared towards network or server infrastructure but can usually do some of both.
Tools like Cacti might be a great option for increasing awareness of the networks connecting your infrastructure. It's similar to SmokePing in that it reaches into the network to gather health information, but it's designed to be more granular. Instead of just "is that thing there, and how quickly did it respond?" You can interrogate target machines for details like network traffic stats, load, or various resource utilization. Cacti focuses on network infrastructure more than servers and primarily uses SNMP to monitor things and gather data.
Infrastructure monitoring
Beyond increasing visibility into the overall connectivity between different infrastructure components, it can be invaluable to have insight into the health and other aspects of the services, hardware, or multitude of other things you run. Knowing that a machine responds to a ping or SNMP request is helpful. Graphing the disk latency, number of users logged in, memory usage, or other details gives much more useful data to help you make decisions about the health of a system or a set of connected systems.
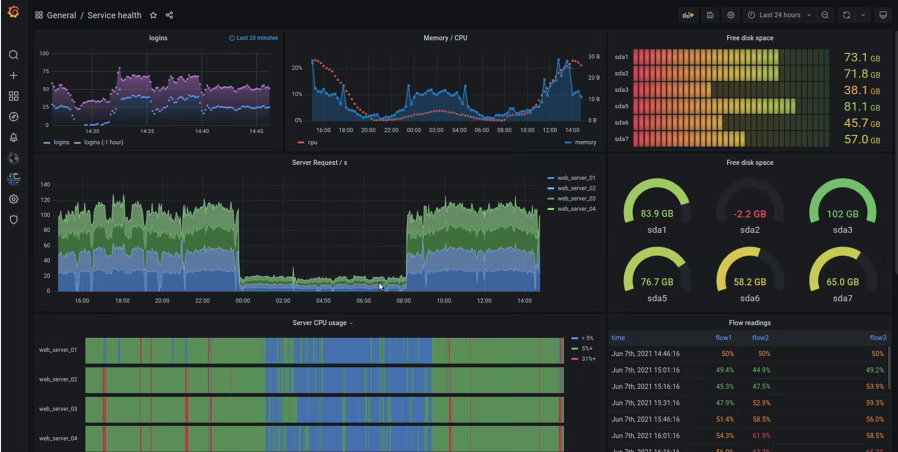
Grafana is one of the most popular tools for presenting this type of data in a visual medium.

Grafana is endlessly customizable. You get a ton of control over what data to collect and how to present the data. Individual users can build dashboards to get the information that matters to their role.
One thing it doesn't do is collecting and storing these data points. For that, you'll want something like Prometheus.
[ Time to say goodbye? Learn how to decommission a system: 3 keys to success. ]
You can configure Prometheus as a backend for Grafana, and it has a lot of capability to receive and retrieve data from endpoints. Prometheus also provides a very robust way to query the data it stores, outside of using a visualization tool like Grafana. Its PromQL query language allows you to build your own queries live and save them to find patterns or issues before they become serious problems.
Once you're collecting data and can make sense of it using some handy graphs, the next step on your journey should be setting up something to help alert you when conditions warrant attention. Tools like Alertmanager (as part of Prometheus) can bridge the gap between "I can see my infrastructure" and "I know when there's a problem without having to take the time to look through graphs, stats, or messages."
Parting thoughts
At the end of the day, there's no one-size-fits-all answer for how to begin (or improve) infrastructure monitoring and observability. Your best bet is to test tools like SmokePing, Cacti, Grafana, Prometheus, and Alertmanager to see how they fit into your environment. It also might make more sense to run multiple tools for different use cases, depending on your environment.
저자 소개
채널별 검색
오토메이션
기술, 팀, 인프라를 위한 IT 자동화 최신 동향
인공지능
고객이 어디서나 AI 워크로드를 실행할 수 있도록 지원하는 플랫폼 업데이트
오픈 하이브리드 클라우드
하이브리드 클라우드로 더욱 유연한 미래를 구축하는 방법을 알아보세요
보안
환경과 기술 전반에 걸쳐 리스크를 감소하는 방법에 대한 최신 정보
엣지 컴퓨팅
엣지에서의 운영을 단순화하는 플랫폼 업데이트
인프라
세계적으로 인정받은 기업용 Linux 플랫폼에 대한 최신 정보
애플리케이션
복잡한 애플리케이션에 대한 솔루션 더 보기
가상화
온프레미스와 클라우드 환경에서 워크로드를 유연하게 운영하기 위한 엔터프라이즈 가상화의 미래
