
In Red Hat OpenShift 4.5, we enhanced Node views to encompass at-a-glance views right from the Console. This included surfacing key Node data in the List view, offering a new Overview to provide insights into critical data, and adding direct access to your Node with a new Terminal view.
List View
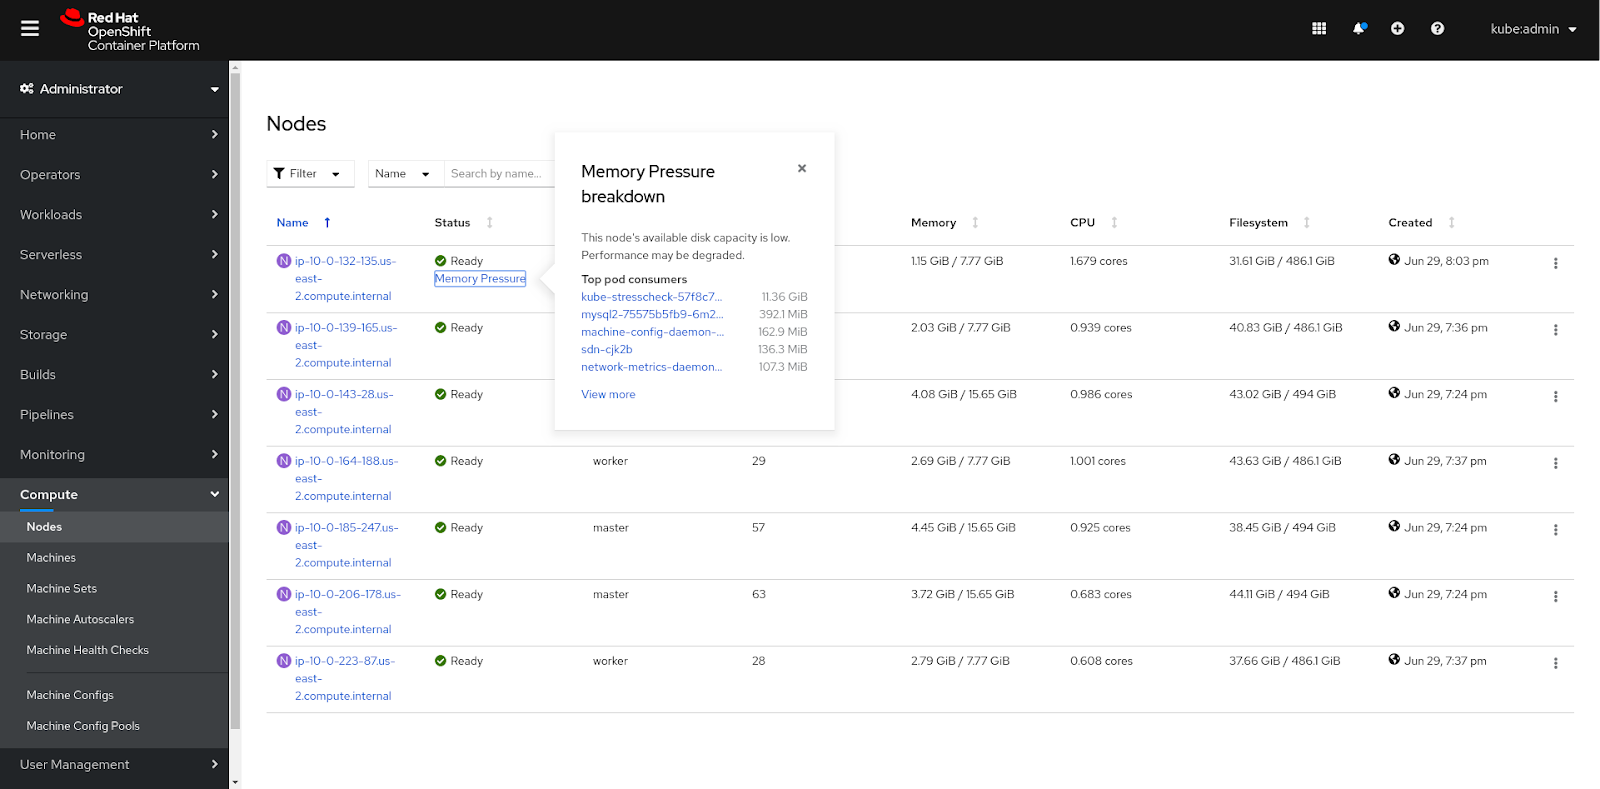
Additional columns are now surfaced in the Node list view, including Pods, CPU, Memory, Filesystem, and Created date, surfacing more node-related critical data to the forefront. The Status column now surfaces degraded status conditions in addition to the other status conditions shown pre-4.5. Lastly, the toolbar within the list view has been updated to include filtering by various statuses and roles as well as filtering by name or label.
Overview
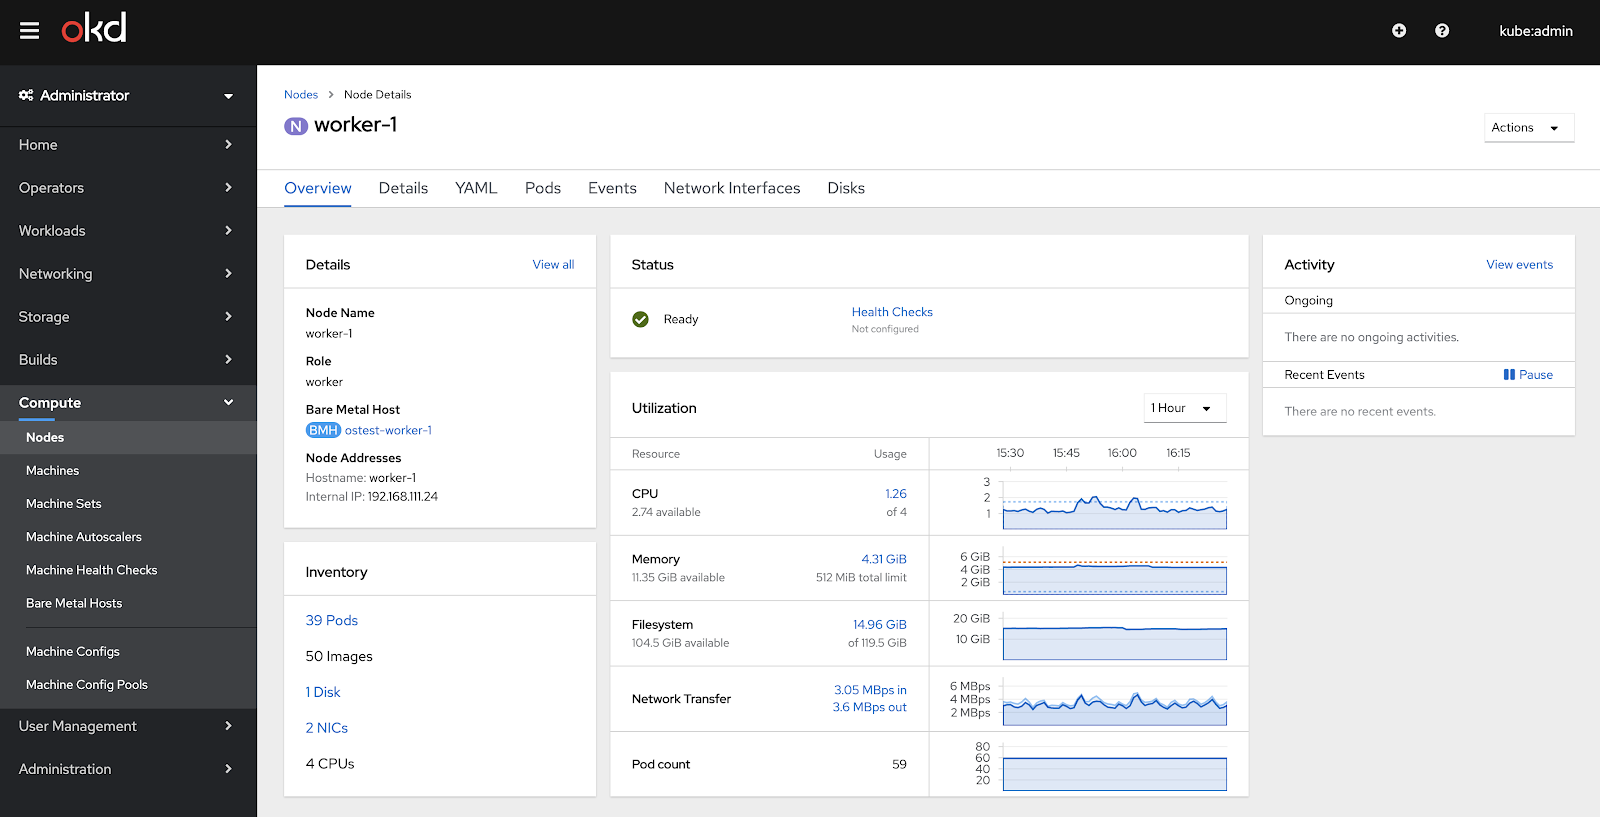
Similar to the Cluster and Project overviews that were introduced in previous OpenShift releases, the new Node Overview provides an at-a-glance view with critical data including Node Details, Inventory, Status, Utilization, and Activity.
Status updates
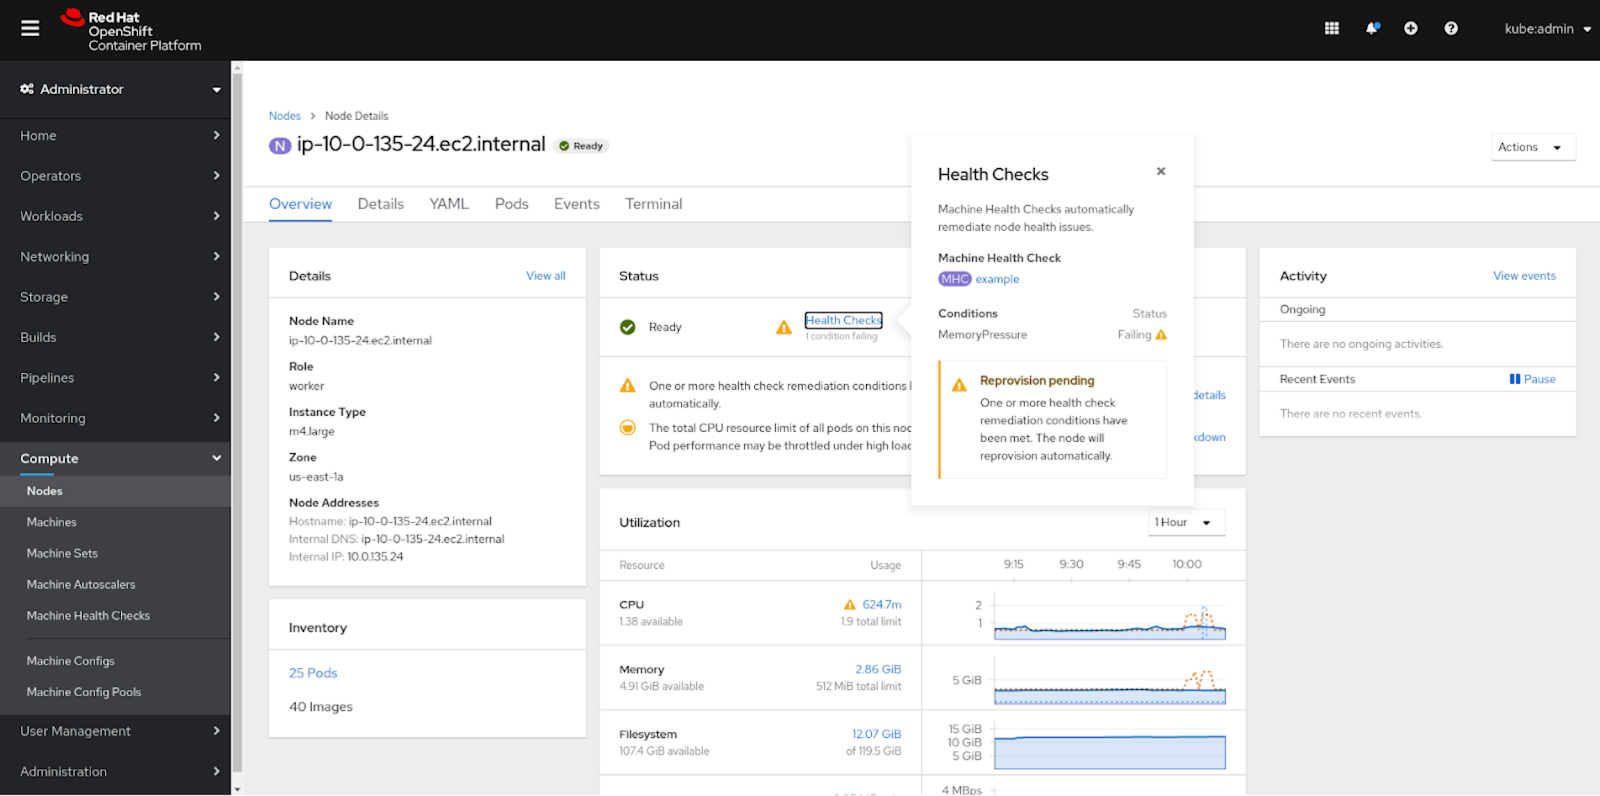
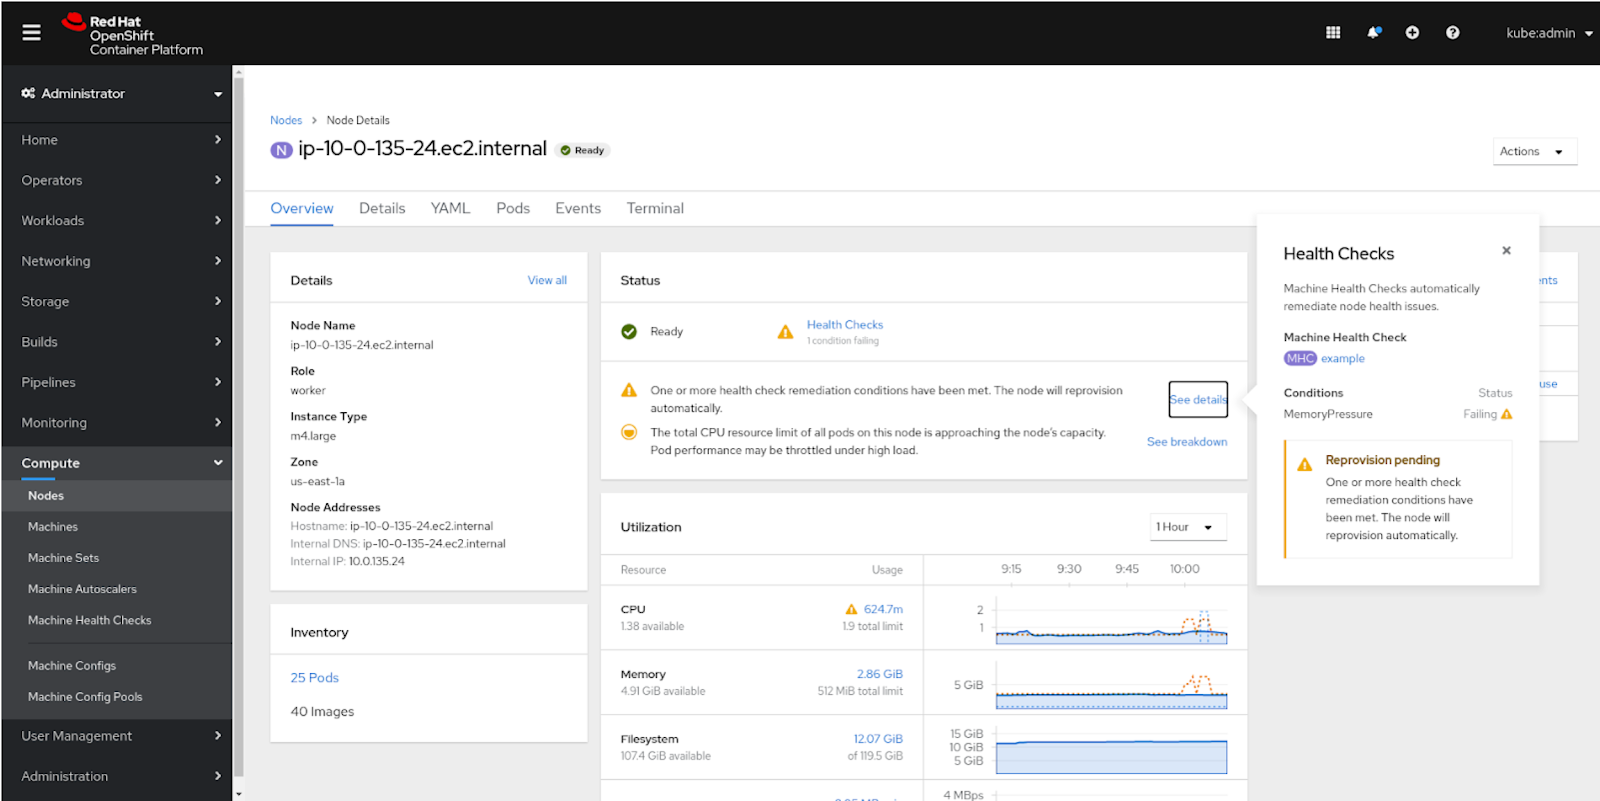
The Node’s status and Health Check statuses (if configured) are represented in the Node Overview’s Status card. If Machine Health Checks are configured, the “Health Checks” link will show a popover when clicked with a breakdown of the conditions and accompanying statuses. If there are any warnings, they will be shown in the popover as well as the ability to edit the Health Check. At the bottom of the Status card, alerts regarding CPU and Memory resource requests and limits will be tracked in addition to the rest of the list.
Utilization Updates
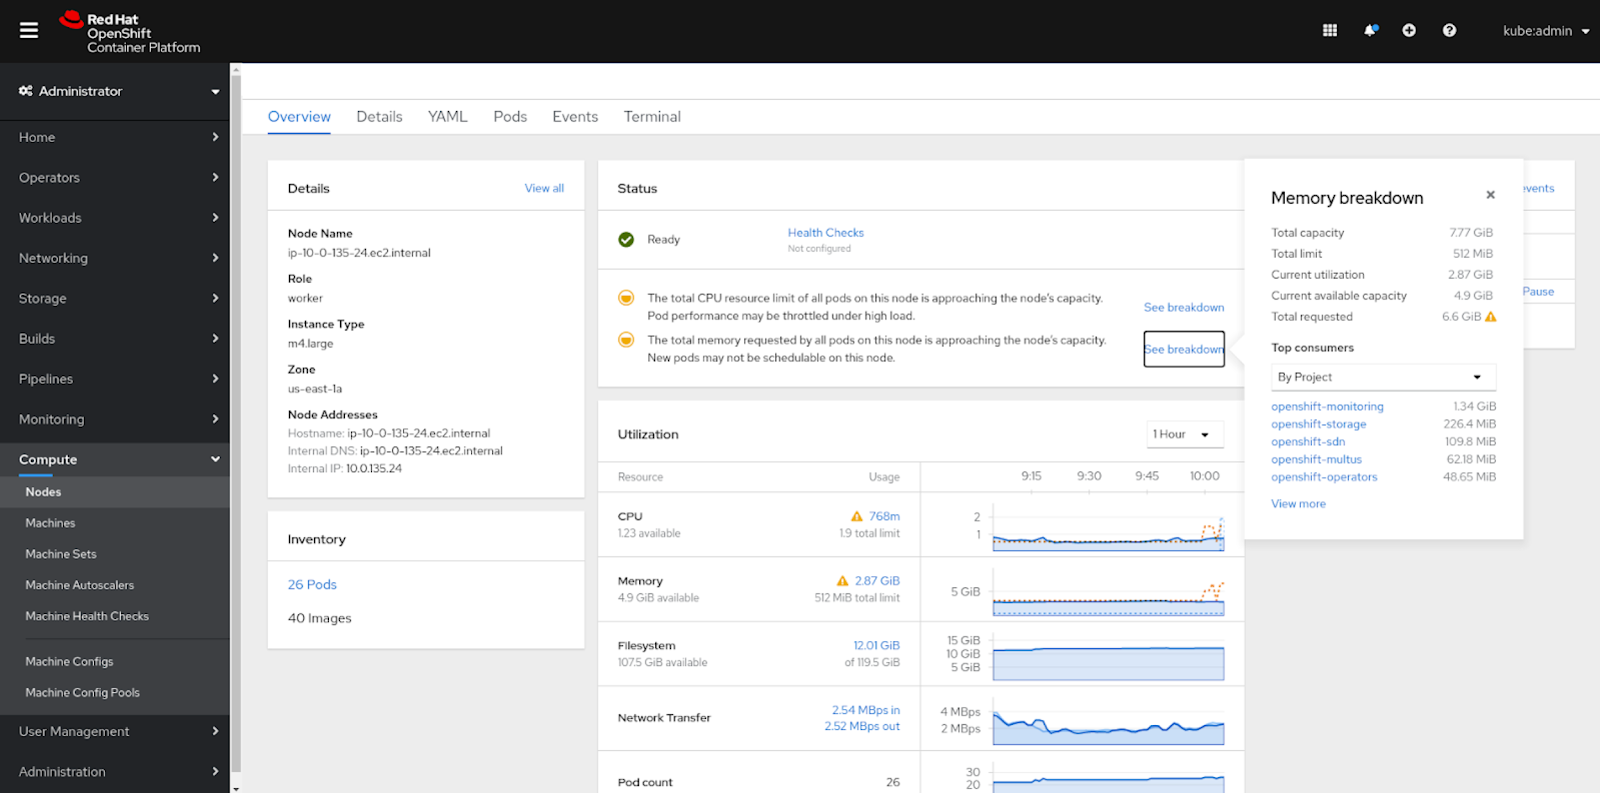
Within the Utilization card, resource utilizations are tracked including CPU, Memory, and Filesystem. Limits and requests per resource are both visualized in the graphs as dotted lines and show specific details if hovered over. Depending on the total resource limit and total requests, specific status messages will appear in the Status card depending on the percentage of Node capacity reached. Each message is accompanied by a “See breakdown” link that brings up a popover if clicked on with more information about the resource’s utilization.

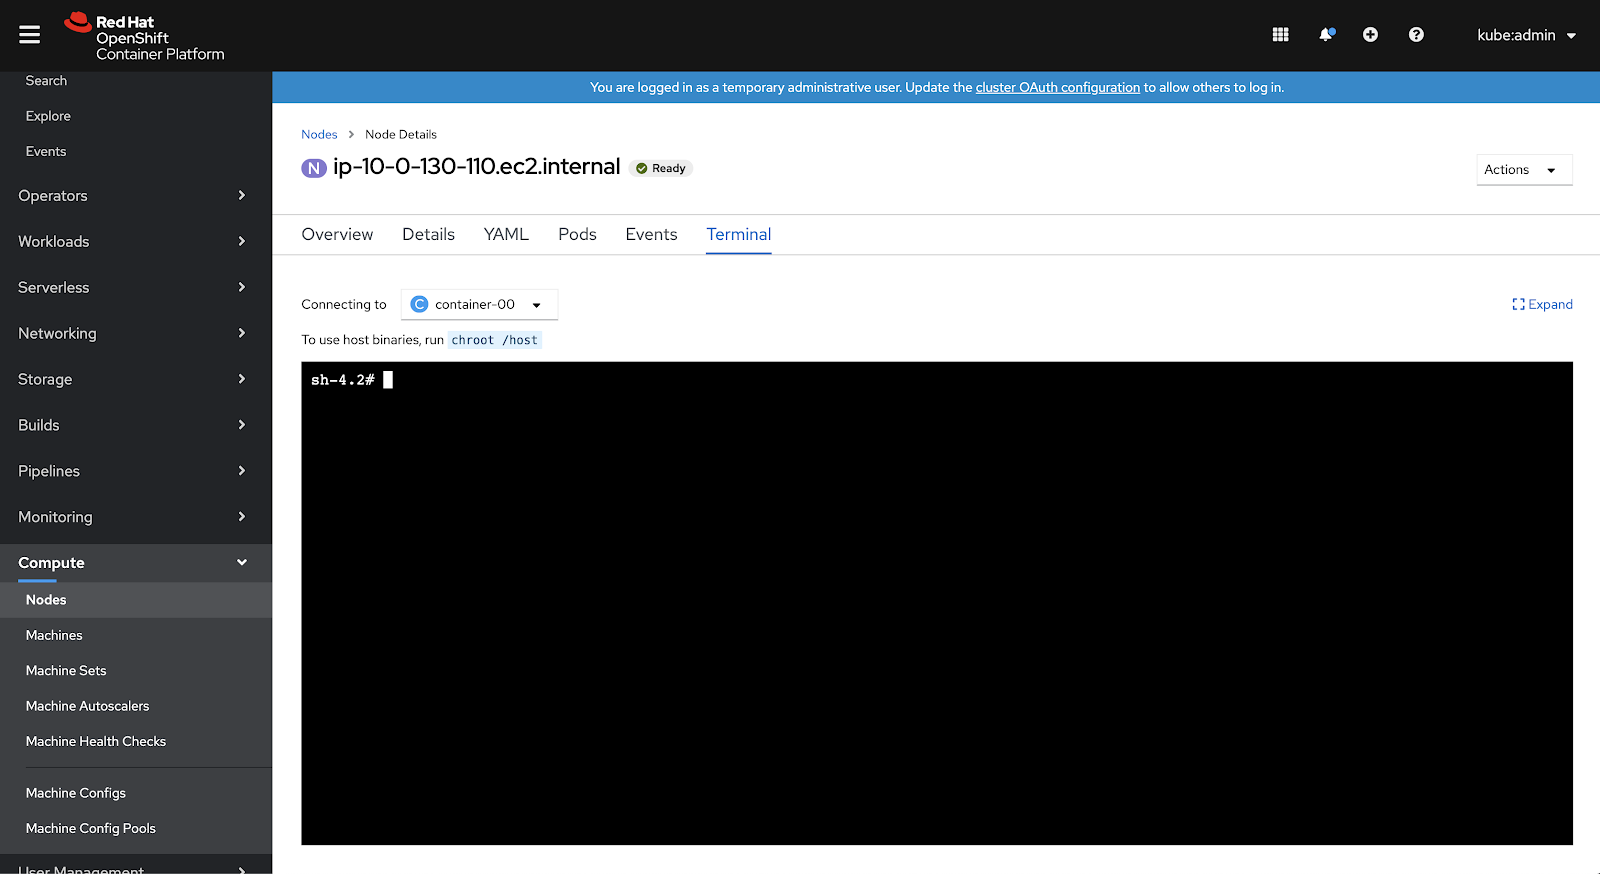
Terminal
The new Terminal view provides direct access to the Node without having to leave the Console. It streamlines the node troubleshooting and debugging processes for admins. You can access the view by going to the Terminal tab alongside the rest of the Node tabs, such as, Details, YAML, and others. The Terminal view allows you to access Node logs through journalctl, enabling you to view system logs collected by systemd.
Bare Metal
Overview highlights
If a Bare Metal cluster is in use, there are key highlights added to the Overview page related to the cluster. One of them is the underlying BareMetalHost resource (the physical computer powering this “node”), which is displayed in the Details card. Another addition to the view is information on Disks, NICs, and CPUs, which are displayed in the Inventory card.
In summary, the Node Overview enhancements in 4.5 allow quick and easy access to critical data and Nodes themselves. Status and utilization insights are all provided within one view, making it easy to get an at-a-glance look at what is happening within your Node. And finally, debugging and troubleshooting Nodes is easier than ever with direct access to the Terminal.
{{cta('1ba92822-e866-48f0-8a92-ade9f0c3b6ca')}}
저자 소개
유사한 검색 결과
과거의 운영 방식에서 벗어나 IT의 미래 구축
AI의 다음 변곡점: 에이전트를 엔터프라이즈 슈퍼유저로 전환
Crack the Cloud_Open | Command Line Heroes
Edge computing covered and diced | Technically Speaking
채널별 검색

오토메이션
기술, 팀, 인프라를 위한 IT 자동화 최신 동향

인공지능
고객이 어디서나 AI 워크로드를 실행할 수 있도록 지원하는 플랫폼 업데이트

오픈 하이브리드 클라우드
하이브리드 클라우드로 더욱 유연한 미래를 구축하는 방법을 알아보세요

보안
환경과 기술 전반에 걸쳐 리스크를 감소하는 방법에 대한 최신 정보

엣지 컴퓨팅
엣지에서의 운영을 단순화하는 플랫폼 업데이트

인프라
세계적으로 인정받은 기업용 Linux 플랫폼에 대한 최신 정보

애플리케이션
복잡한 애플리케이션에 대한 솔루션 더 보기
가상화
온프레미스와 클라우드 환경에서 워크로드를 유연하게 운영하기 위한 엔터프라이즈 가상화의 미래