
In this article I will demonstrate how to prepare and configure Loki and how to use LogForwarder to forward OpenShift logs to this service.
In this article, we will use a Red Hat Enterprise Linux 8 (rhel8) server to run our Loki stack, which will be composed of Loki, Grafana and PromTail, we will use podman and podman-compose to manage our stack.
Lets go to what matters.
Loki Server
First, let's start our Loki, for that we will use a rhel8 server
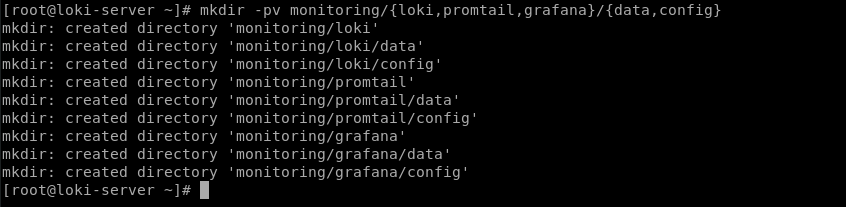
- Let's create the following directory structure
[root@loki-server ~]# mkdir -pv monitoring/{loki,promtail,grafana}/{data,config}
- We will also leave our provisioning directory created for later use.
[root@loki-server ~]# mkdir -pv /root/monitoring/grafana/data/provisioning/datasources
- Now let's create our
docker-compose.yaml.
version: "3"
services:
  loki:
    image: grafana/loki:2.5.0
    volumes:
      - /root/monitoring/loki/config:/mnt/config
    ports:
      - "3100:3100"
    command: -config.file=/mnt/config/loki-config.yaml
    user: loki
    networks:
      - loki

  promtail:
    privileged: true
    image: grafana/promtail:2.5.0
    volumes:
      - /root/monitoring/promtail/config:/mnt/config
      - /var/log:/var/log
    command: -config.file=/mnt/config/promtail-config.yaml
    ports:
      - "9080:9080"
    user: root
    networks:
      - loki

  grafana:
    image: grafana/grafana:latest
    volumes:
      - grafana-storage:/var/lib/grafana
      - /root/monitoring/grafana/data/provisioning:/etc/grafana/provisioning
    environment:
      - GF_INSTALL_PLUGIN='grafana-simple-json-datasource'
    ports:
      - "3000:3000"
    networks:
      - loki

networks:
  loki:

volumes:
  grafana-storage:
-
Now let's create our configuration files, starting with
promtail-config.yaml.- Promtail is an agent which ships the contents of local logs to a private Grafana Loki instance. It is usually deployed to every machine that has applications needed to be monitored.
[root@loki-server ~]# cat /root/monitoring/promtail/config/promtail-config.yaml
server:
  http_listen_port: 9080
  grpc_listen_port: 0

positions:
  filename: /tmp/positions.yaml

clients:
  - url: http://loki-server:3100/loki/api/v1/push

scrape_configs:
- job_name: system
  static_configs:
  - targets:
      - localhost
    labels:
      job: varlogs
      __path__: /var/log/**
Adjust the url according to your scenario, inform the host server followed by the api context for communication.
Obs.: In this scenario, promtail is just forwarding logs from the /var/log directory to Loki, which is not a necessary component for receiving logs from Openshift.
- Now let's create our
loki-config.yamlfile
[root@loki-server ~]# cat /root/monitoring/loki/config/loki-config.yaml
auth_enabled: false

server:
  http_listen_port: 3100
  grpc_listen_port: 9096
  grpc_server_max_recv_msg_size: 8388608

common:
  path_prefix: /tmp/loki
  storage:
    filesystem:
      chunks_directory: /tmp/loki/chunks
      rules_directory: /tmp/loki/rules
  replication_factor: 1
  ring:
    instance_addr: 127.0.0.1
    kvstore:
      store: inmemory

schema_config:
  configs:
    - from: 2020-10-24
      store: boltdb-shipper
      object_store: filesystem
      schema: v11
      index:
        prefix: index_
        period: 24h

ingester:
  wal:
    enabled: true
    dir: /tmp/wal
  lifecycler:
    address: 127.0.0.1
    ring:
      kvstore:
        store: inmemory
      replication_factor: 1
    final_sleep: 0s
  chunk_idle_period: 1h       # Any chunk not receiving new logs in this time will be flushed
  chunk_target_size: 8388608
  max_chunk_age: 1h           # All chunks will be flushed when they hit this age, default is 1h
  chunk_retain_period: 30s    # Must be greater than index read cache TTL if using an index cache (Default index read cache TTL is 5m)
  max_transfer_retries: 0     # Chunk transfers disabled

storage_config:
  boltdb_shipper:
    active_index_directory: /tmp/loki/boltdb-shipper-active
    cache_location: /tmp/loki/boltdb-shipper-cache
    cache_ttl: 24h
    shared_store: filesystem
  filesystem:
    directory: /tmp/loki/chunks

compactor:
  working_directory: /tmp/loki/boltdb-shipper-compactor
  shared_store: filesystem

limits_config:
  reject_old_samples: true
  reject_old_samples_max_age: 12h
  ingestion_rate_mb: 8
  ingestion_burst_size_mb: 16

chunk_store_config:
  max_look_back_period: 0s

table_manager:
  retention_deletes_enabled: false
  retention_period: 0s

ruler:
  storage:
    type: local
    local:
      directory: /tmp/loki/rules
  rule_path: /tmp/loki/rules-temp
  ring:
    kvstore:
      store: inmemory
  enable_api: true
This configuration can be found in the documentation, in the troubleshooting item, demonstrating the recommendations and best practices, link in the document references.
-
Now let's start our stack and validate that everything is working correctly
- Run the command below to start the services
[root@loki-server ~]# podman-compose --project-name monitoring up -d
- To validate that the containers were uploaded correctly, run the following command
[root@loki-server ~]# podman ps

- If your result is the same, let's validate if grafana is accessible
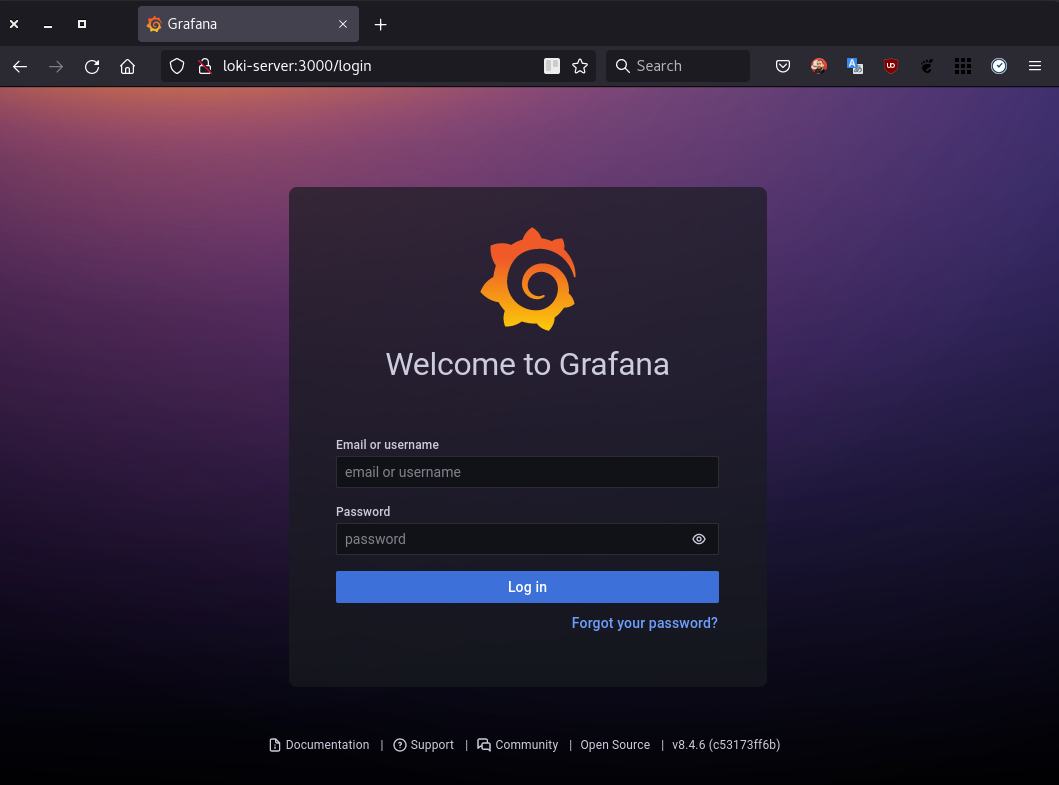
Obs.: To access grafana use the username and password as
admin
- Now we need to add our datasource pointing to the Loki endpoint and then use the Grafana interface to view our logs.
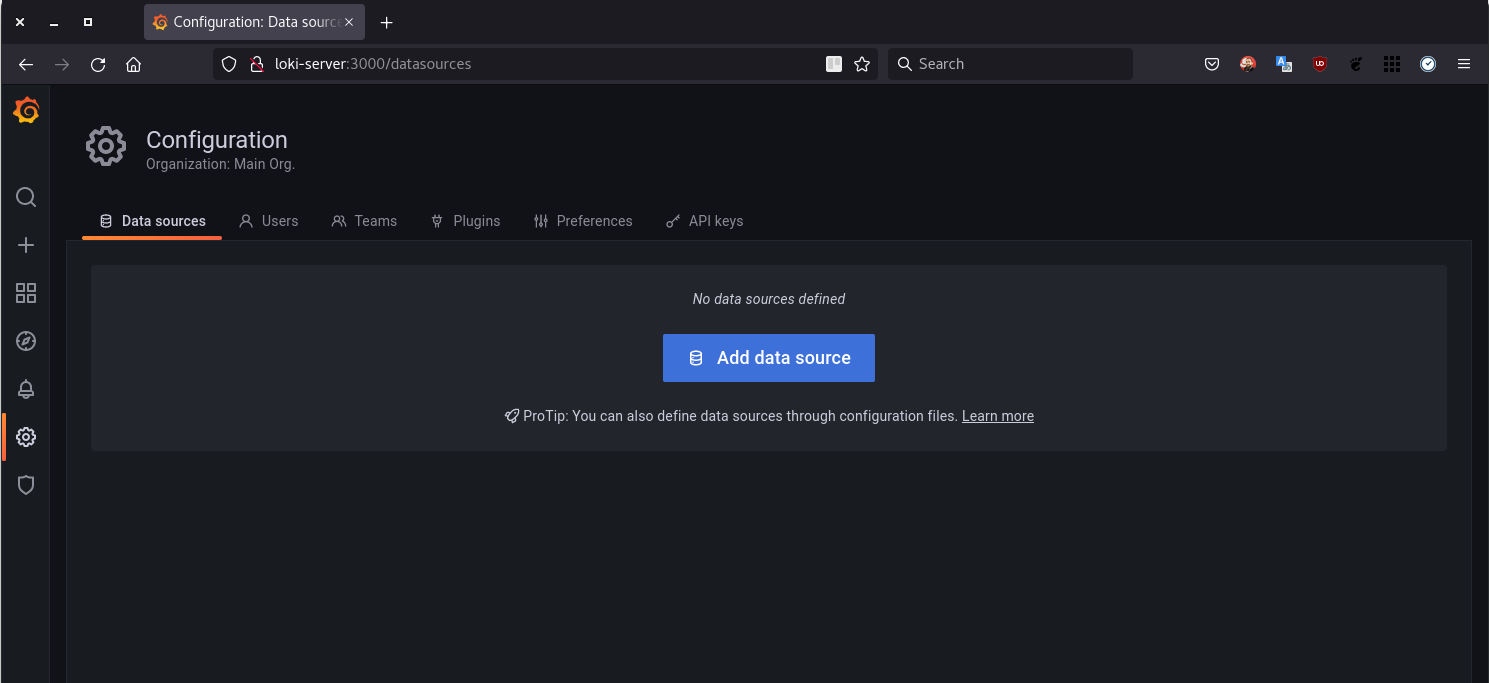
- So that we have our datasource being automatically configured as soon as we install our instance, we are going to use the Grafana
PROVISIONINGfeature, for that, create the following file:
[root@loki-server ~]# cat /root/monitoring/grafana/data/provisioning/datasources/loki.yaml
apiVersion: 1
datasources:
 - name: Loki
   type: loki
   access: proxy
   orgId: 1
   url: http://loki-server:3100
   isDefault: true
   version: 1
   editable: true
This resource will configure a datasource of type
loki, already pointing to theurlof the loki server running on port3100of my host.
- After that, run the following command to restart and apply our configuration to datasource
[root@loki-server ~]# podman pod restart monitoring
![]()
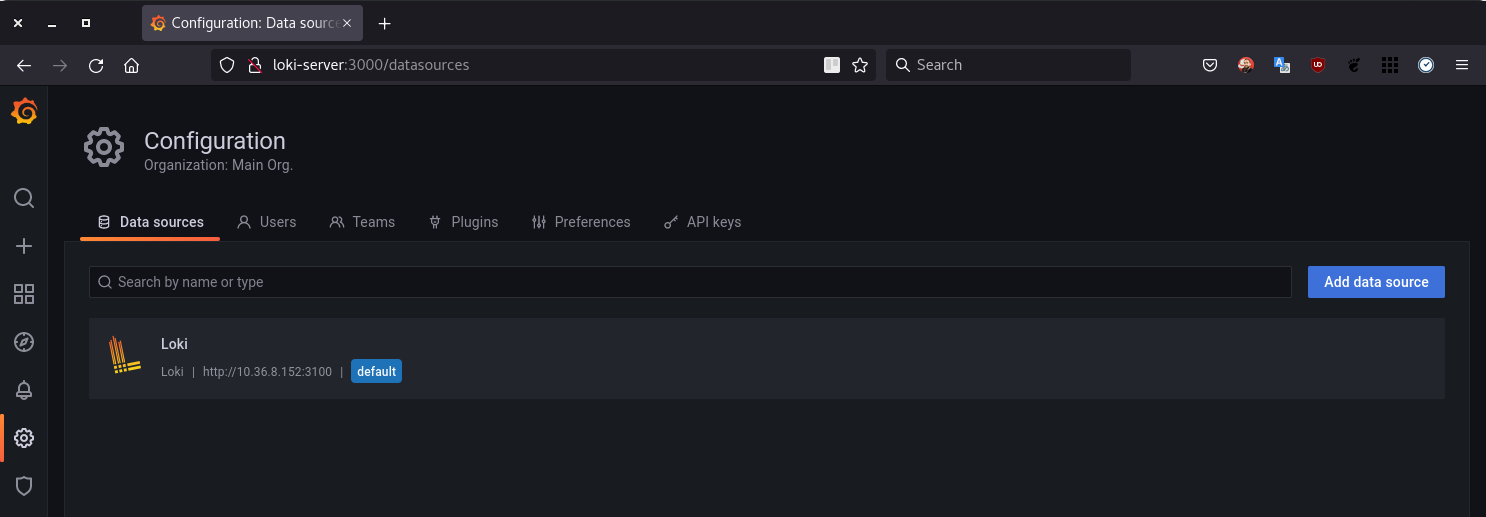
- Now we can go back to the Grafana interface and validate that our datasource was created successfully
- To test our Loki using promtail with local logs, let's create the Explore icon in the side menu, now let's run the following query to validate
{filename="/var/log/messages"}
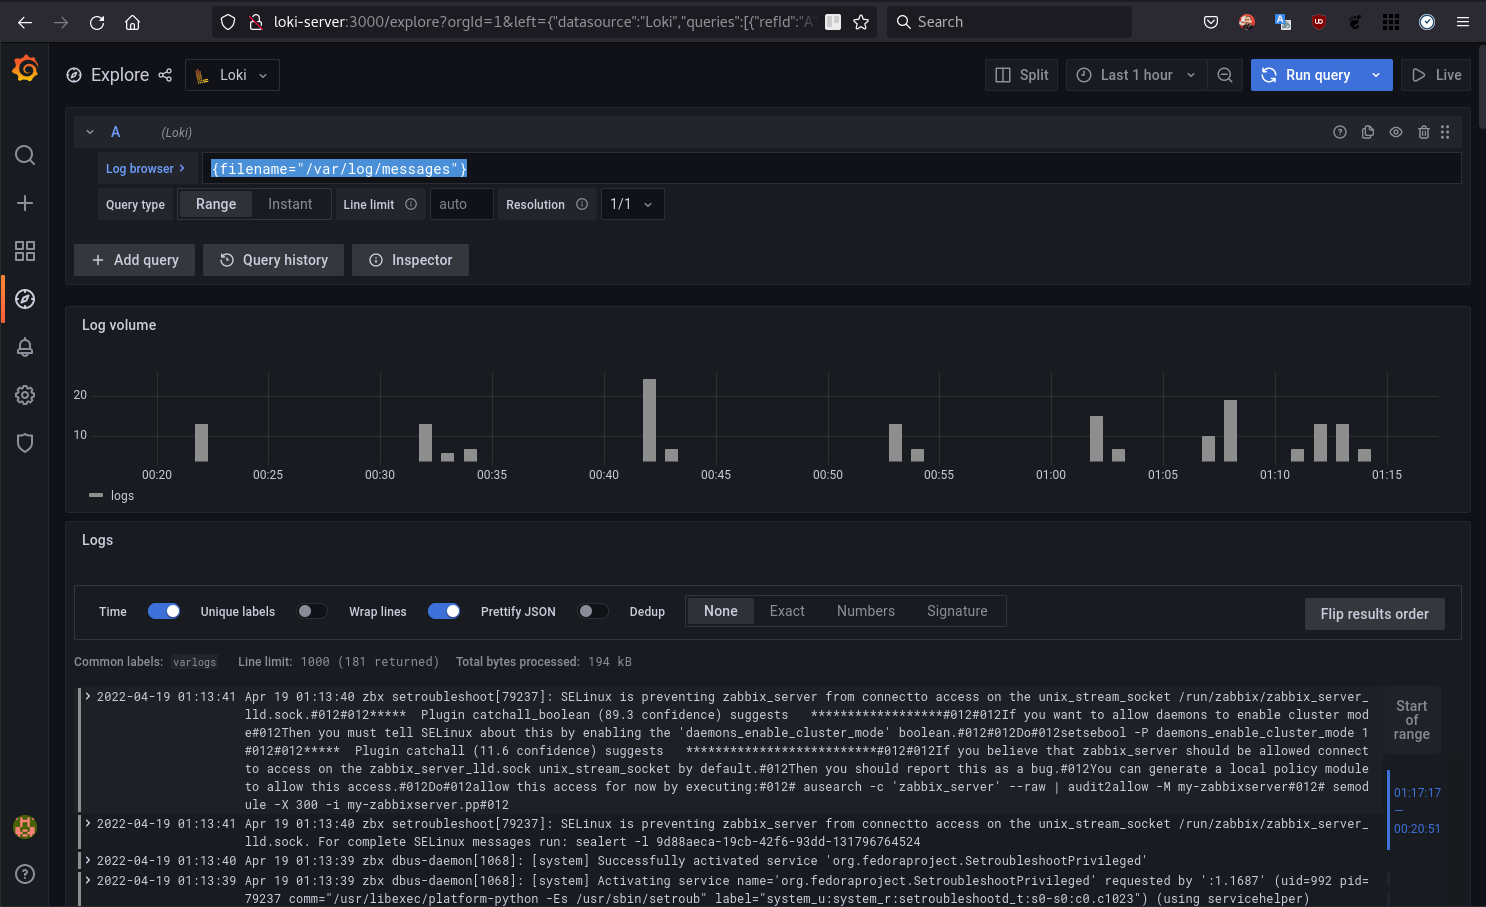
Now that we know that our Loki is working properly, let's move on to OpenShift.
OpenShift LogForwarder
Obs.: This article does not include the installation of OpenShift Logging, for more information, see the reference link.
-
Now in the OpenShift interface
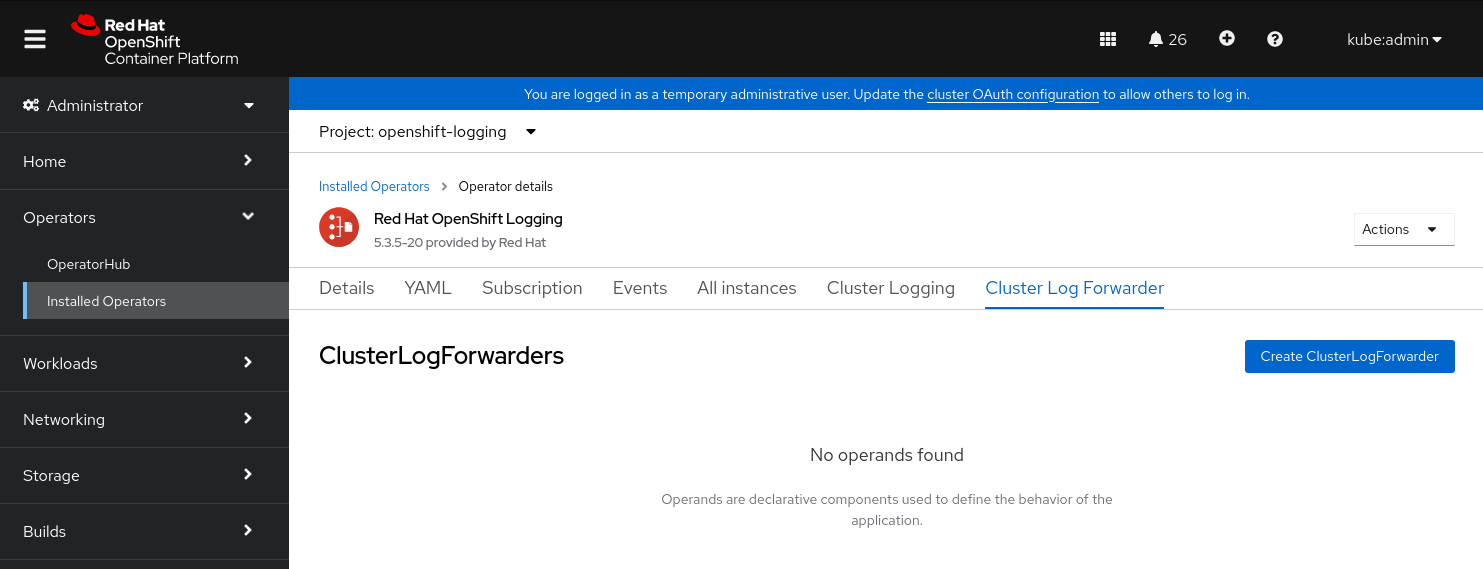
- In the side menu, select
Installed Operators> Select theopenshift-logging project> Then click on "Cluster Log Forwarder" in Provided API's.
- In the side menu, select

- Now click on "
Create ClusterLogForwarder"
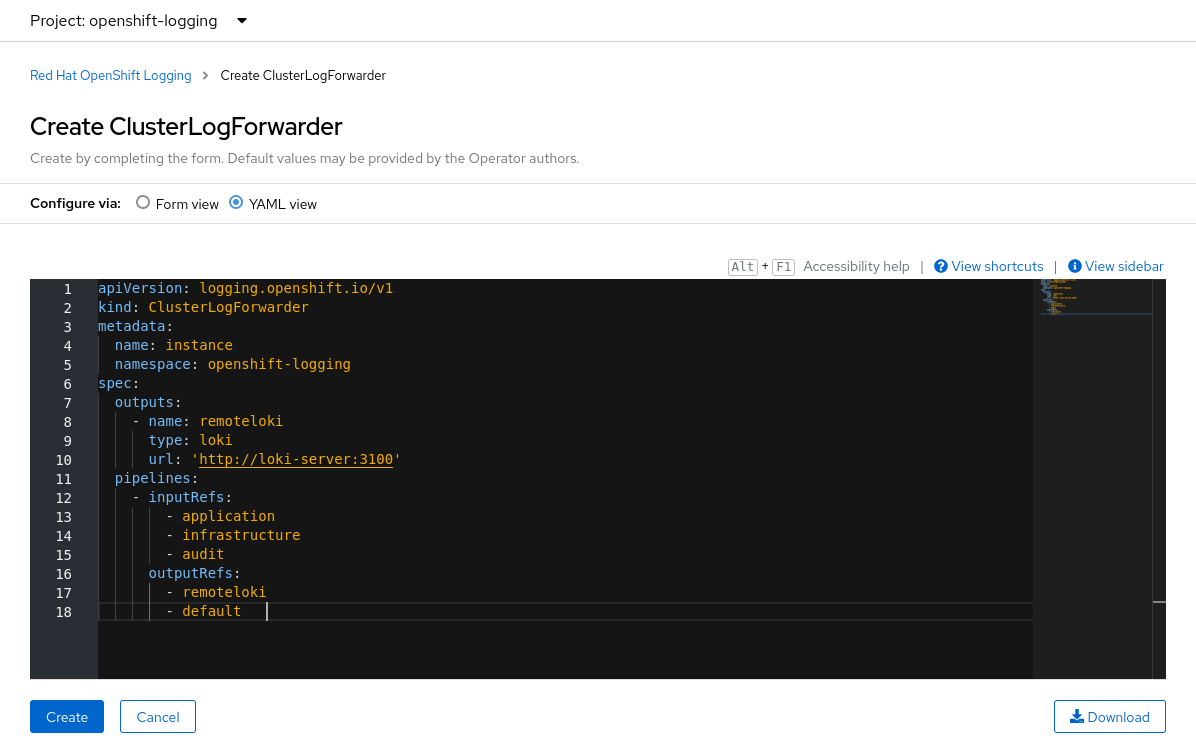
- In this yaml, we register our loki-server as
remotelokiand in thepipeline, we are informing that we want theapplication, infrastructure and auditlogs to be forwarded toremotelokiand to thedefault, which in this case is theinternal elasticsearchof Openhift Logging.
apiVersion: logging.openshift.io/v1
kind: ClusterLogForwarder
metadata:
  name: instance
  namespace: openshift-logging
spec:
  outputs:
    - name: remoteloki
      type: loki
      url: 'http://loki-server:3100'
  pipelines:
    - inputRefs:
        - application
        - infrastructure
        - audit
      outputRefs:
        - remoteloki
        - default
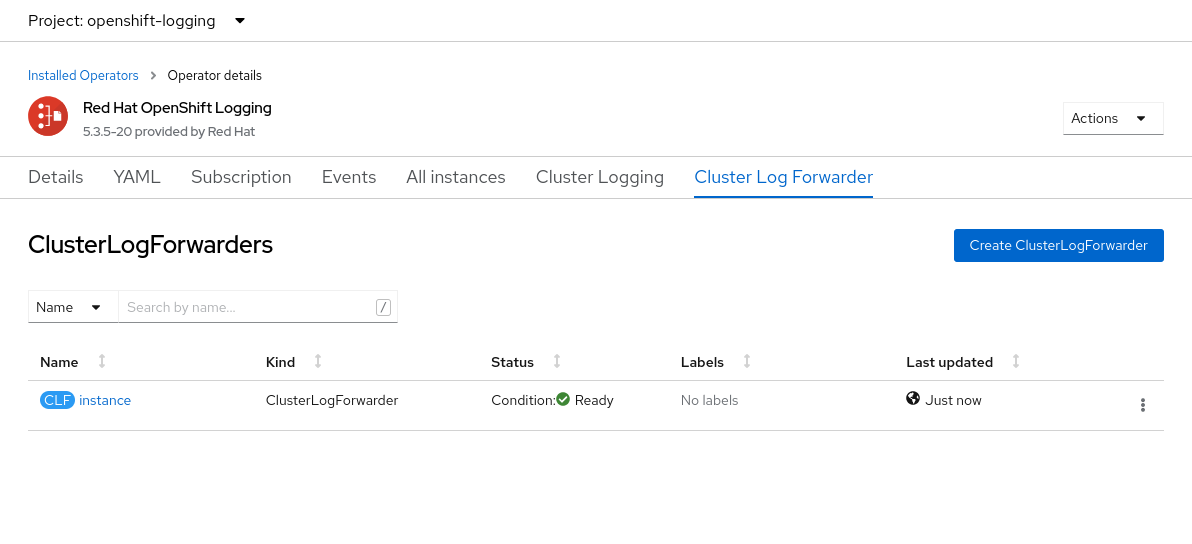
- After clicking Create, wait until the status is "
Condition: Ready", as shown in the image below
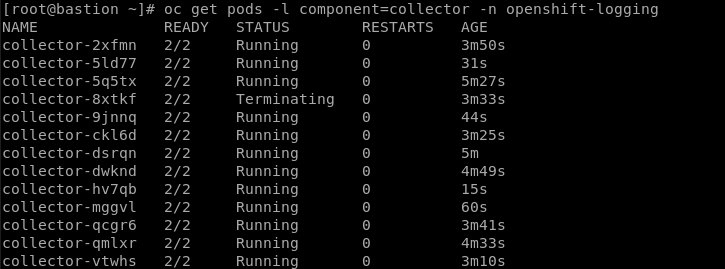
- After this process, the new configuration needs to be applied to the collector(fluentd) pods, wait until all have been restarted and have the new configuration
[root@bastion ~]# oc get pods -l component=collector -n openshift-logging
- Now back in Grafana, we can run the query below to validate that our logs are being successfully received from OpenShift
{log_type="application"}

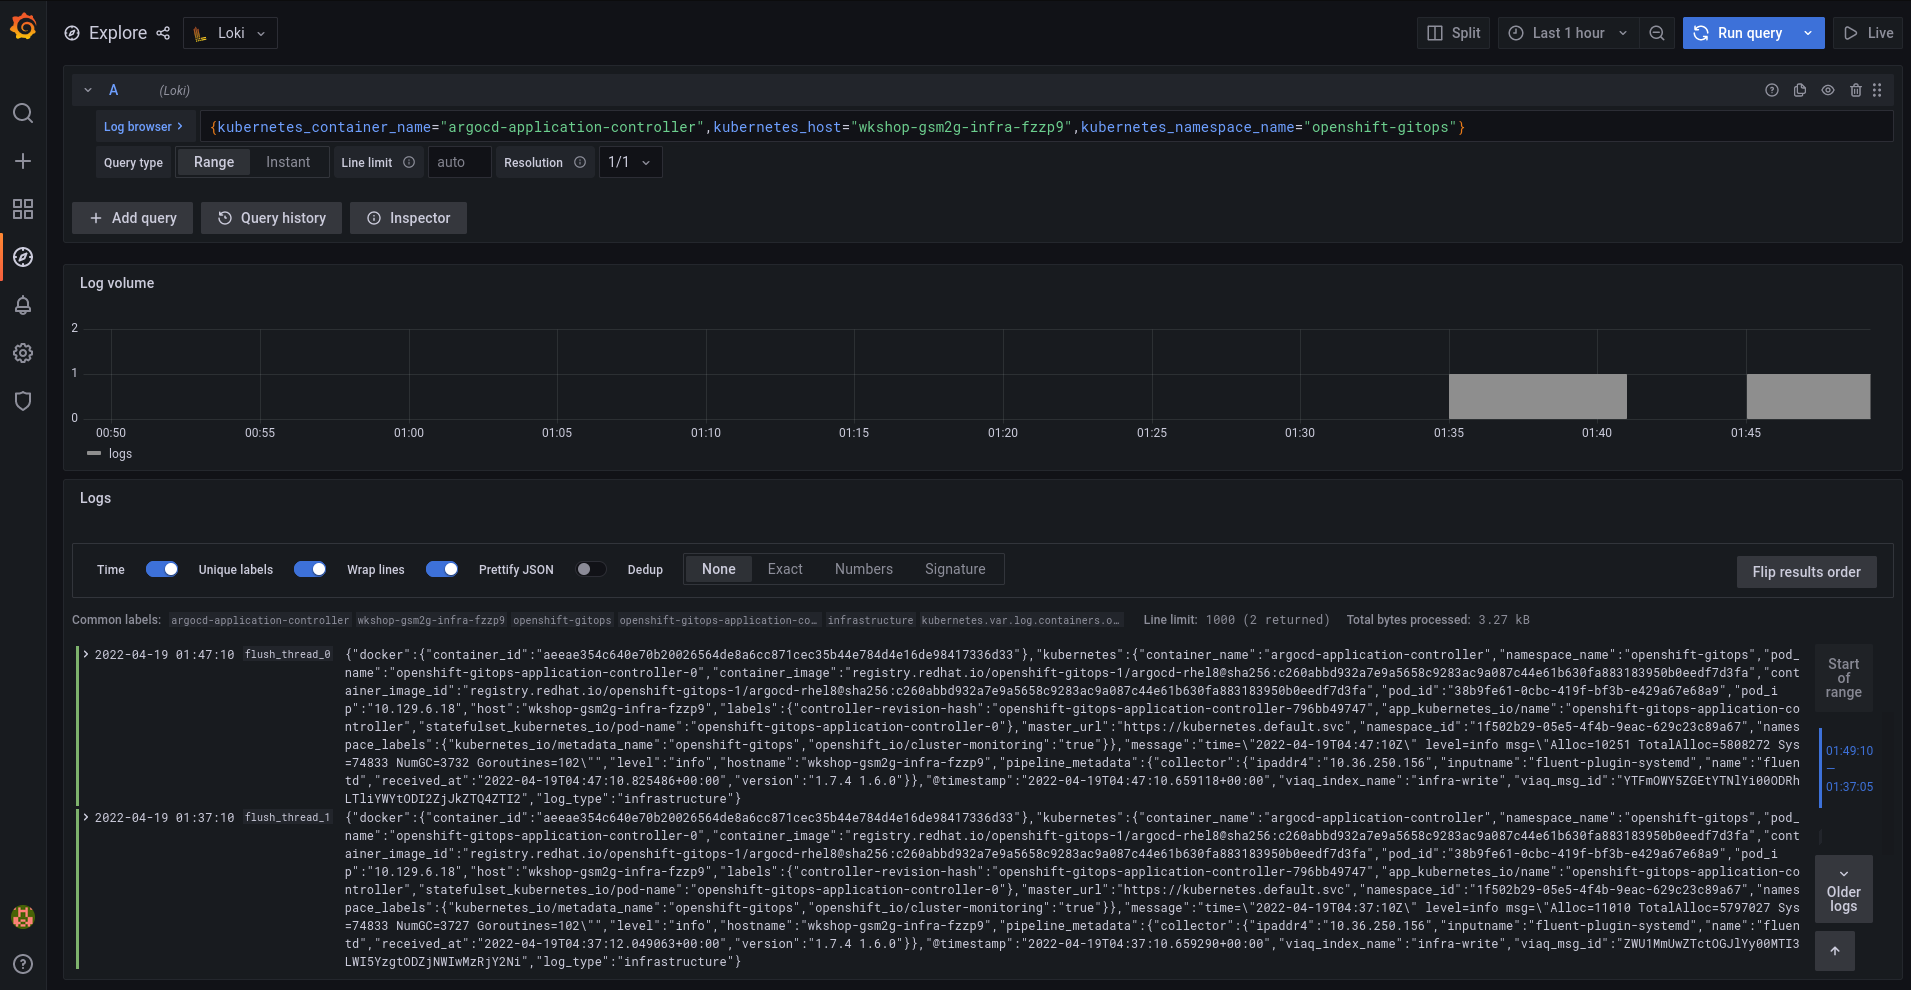
- For more query and filter options, click the "
Log browser" button, then select the items you want to query and then "Show logs"

Example:
{kubernetes_container_name="argocd-application-controller",kubernetes_host="wkshop-gsm2g-infra-fzzp9",kubernetes_namespace_name="openshift-gitops"}
References:
저자 소개
유사한 검색 결과
과거의 운영 방식에서 벗어나 IT의 미래 구축
AI의 다음 변곡점: 에이전트를 엔터프라이즈 슈퍼유저로 전환
Crack the Cloud_Open | Command Line Heroes
Edge computing covered and diced | Technically Speaking
채널별 검색

오토메이션
기술, 팀, 인프라를 위한 IT 자동화 최신 동향

인공지능
고객이 어디서나 AI 워크로드를 실행할 수 있도록 지원하는 플랫폼 업데이트

오픈 하이브리드 클라우드
하이브리드 클라우드로 더욱 유연한 미래를 구축하는 방법을 알아보세요

보안
환경과 기술 전반에 걸쳐 리스크를 감소하는 방법에 대한 최신 정보

엣지 컴퓨팅
엣지에서의 운영을 단순화하는 플랫폼 업데이트

인프라
세계적으로 인정받은 기업용 Linux 플랫폼에 대한 최신 정보

애플리케이션
복잡한 애플리케이션에 대한 솔루션 더 보기
가상화
온프레미스와 클라우드 환경에서 워크로드를 유연하게 운영하기 위한 엔터프라이즈 가상화의 미래