

In our previous article, we detailed common issues experienced when deploying IT automation at scale. In this article, we explore how to troubleshoot those issues using monitoring. Here's an example scenario to consider:
A company establishes Ansible Automation Platform as the backbone of its global IT automation deployment. The architecture consists of a half-dozen Ansible automation controller clusters, each with up to 10 instances running in containers on top of OpenShift. Some of these clusters support hundreds of users running thousands of jobs a day against tens of thousands of hosts. Eventually, some of the clusters start experiencing performance issues, including the following symptoms:
- An unresponsive web UI
- Jobs queuing up and stuck in a pending state
- Hanging jobs that never complete
- Random 500 and 404 errors appearing in the UI and API
These clusters became almost unusable at times, from an unresponsive web UI to the inability to run jobs and other random errors. This affects hundreds of users who can't run automation consistently. After weeks of investigating, they discover multiple issues and solutions.
In this article, we explain how to solve these issue.
Running a containerized automation controller
Running an Ansible automation controller in OpenShift provides an easy way to scale an Ansible automation controller. However, as with any virtualization platform, you need to enable the Ansible automation controller to run as efficiently as possible.
Often, OpenShift runs on top of another virtualization platform, and understanding how resources are used at the various virtualization levels is essential. Overcommitting CPU and memory resources in your virtualization platform can impact OpenShift performance. Therefore, it is important to have a 1:1 commit ratio for CPU and memory in your virtualization platform and let OpenShift manage resource overcommitment. In addition to looking at CPU and memory overcommitment, you need to understand what other pods are running on the OpenShift instances in order to prevent resource conflicts.
Proper management of OpenShift guarantees the availability of the Ansible automation controller and other applications running in the OpenShift environment. Quotas on namespaces set the maximum amount of CPU and memory resources a project can consume, limiting the impact one project can have on other projects. In addition, the request and limit settings for the task container set the CPU and memory resources the Ansible automation controller has for running jobs.
By default, the Ansible automation controller installer sets the CPU request to 1,500 millicores and the memory request to 2GBs. You can use the task_cpu_request and task_mem_request variables to set request sizes for the task container in the Ansible automation controller installer inventory. These settings directly impact the number of forks an Ansible automation controller instance has available for running jobs.
Monitoring clusters
Even when utilizing these techniques, you still need to monitor clusters to ensure the health and performance of the Ansible automation controller. There are various ways to monitor and log automation controllers, either with built-in capabilities or external software.
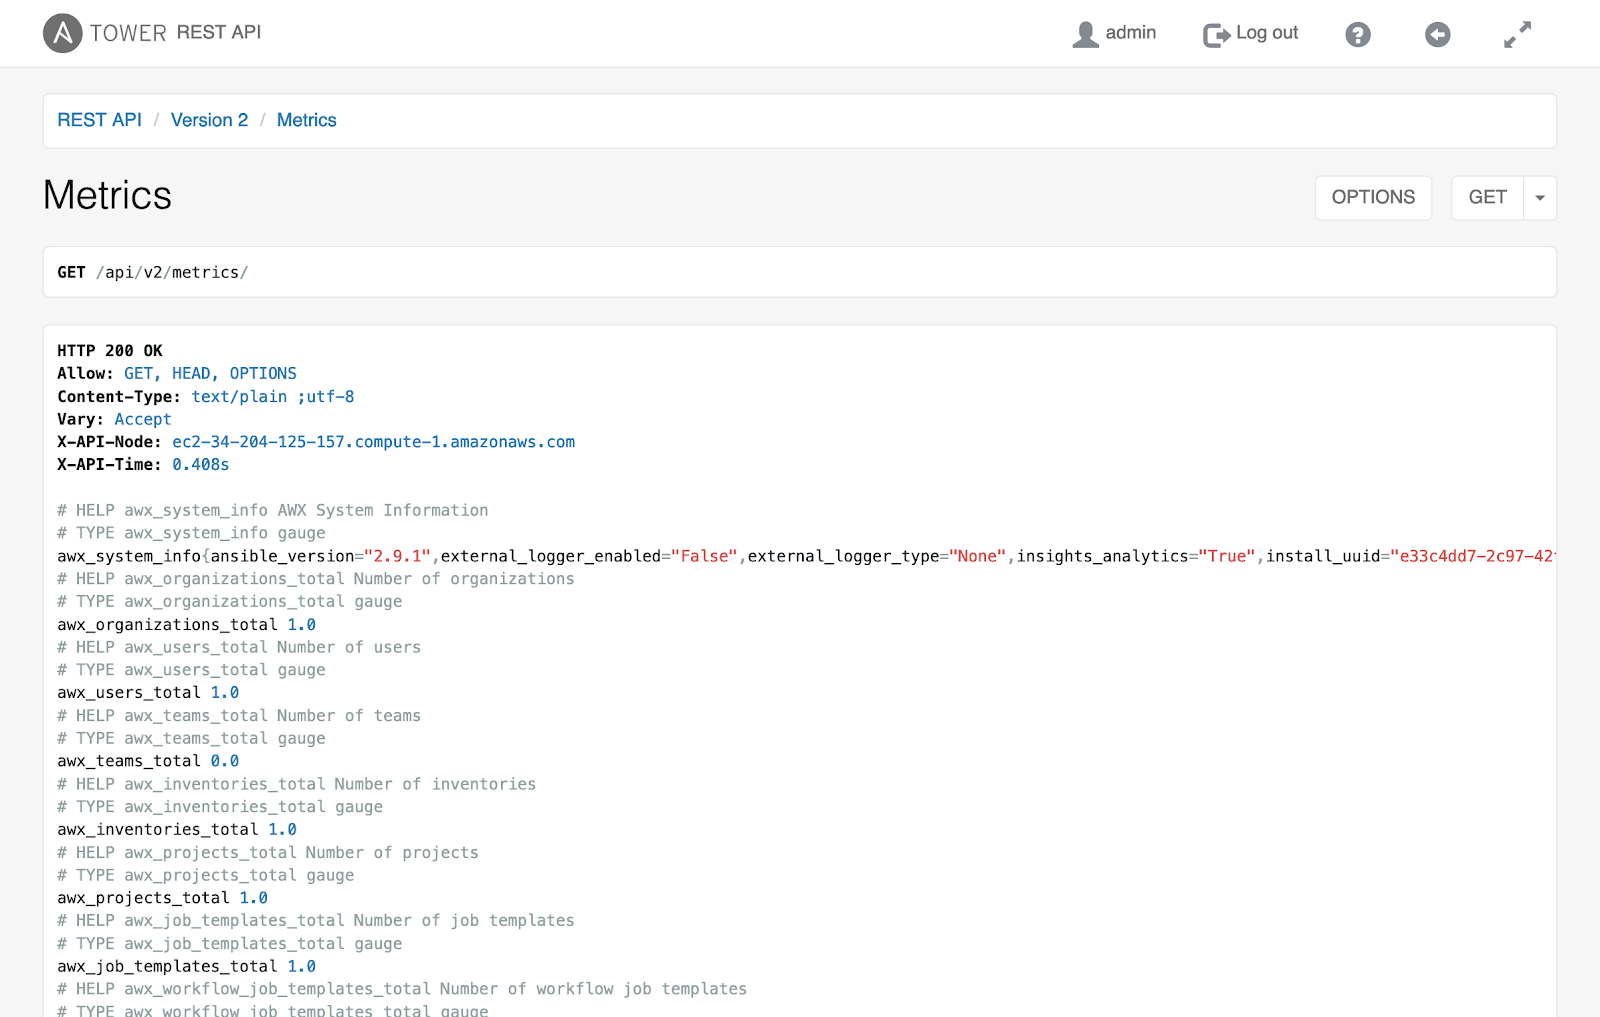
Ansible automation controller comes with built-in metrics for monitoring. The API has multiple endpoints that provide important data about the cluster's health. The most useful endpoint is /api/v2/metrics. By querying it, you can obtain tons of information, including job-run statistics, resource quantities, CPU, memory, and capacity data. Other helpful endpoints include /api/v2/ping and /api/v2/instance_groups.
Here is an example of the /api/v2/metrics endpoint for the Ansible automation controller.
The metrics endpoints become even more useful when combined with external monitoring tools. You can configure Prometheus to scrape the data from the Ansible automation controller and organize it in one place. Then Grafana can use that data and visualize it in the form of graphs for easy interpretation. Both tools allow some degree of alerting to notify admins when something appears wrong with the cluster. Actively monitoring the Ansible automation controller is necessary for both preventing and resolving potential performance issues.
[ You might also be interested in reading An introduction to Prometheus metrics and performance monitoring. ]
Here is an example Grafana graph for Ansible automation controller infrastructure.

Prometheus provides a more advanced feature for gathering lower-level metrics: the Prometheus node-exporter. Node-exporter grants the ability to monitor data from the operating system and OpenShift (if applicable), allowing a holistic view of the Ansible automation controller's health. Since the underlying infrastructure's configuration can cause performance issues, it is important to keep an eye on these types of metrics.
[ Learn more about Red Hat OpenShift Container Platform.]
Besides active monitoring, managing logs is important for keeping the Ansible automation controller healthy. While the automation controller stores its logs by default in its database and on the server, you can configure it to export the logs. Ansible automation controller has native capabilities to integrate with external logging aggregators, like Splunk or Elasticsearch. Exporting logs helps keep the database slim and provides an easier way to investigate performance issues. External tools have easy-to-use interfaces and search capabilities that allow for a user-friendly way to pinpoint errors in the logs when combined with graphical dashboards.
Conclusion
Using Ansible for automation enables teams to repeatedly and accurately perform tasks on the server and network infrastructures and applications. As the use of Ansible increases across an enterprise, Ansible automation controller becomes an important part of the automation architecture, providing a consistent way to execute automation and provide controls such as role-based access control (RBAC) around the automation's execution.
It is important to scale the Ansible automation controller to meet the needs of users and the automation. Properly scaling Ansible automation controller enables continued adoption of automation within an organization and the enterprise. By following the practices outlined here, you can scale Ansible to meet the growing use of automation in your organization.
저자 소개
Brant is a Senior Cloud Architect with Red Hat Consulting. He is an RHCA with more than 25 years of system engineering and automation experience. Outside of working and playing with technology, Brant enjoys spending time with his family and lately has been playing with model trains.
Nick Awtry is a Senior Consultant at Red Hat. He focuses on working with customers to design and implement Red Hat Ansible Automation solutions. In addition to working with technology, Nick enjoys hiking, cooking, and traveling.
유사한 검색 결과
빠르게 진화하는 AI 위협, 더 빠른 대응
관리에서 벗어나 오케스트레이션으로 전환: Red Hat Ansible Automation Platform을 통한 Catalyst 운영 간소화
Container Roundup | Compiler
Untangling Networks | Compiler
채널별 검색

오토메이션
기술, 팀, 인프라를 위한 IT 자동화 최신 동향

인공지능
고객이 어디서나 AI 워크로드를 실행할 수 있도록 지원하는 플랫폼 업데이트

오픈 하이브리드 클라우드
하이브리드 클라우드로 더욱 유연한 미래를 구축하는 방법을 알아보세요

보안
환경과 기술 전반에 걸쳐 리스크를 감소하는 방법에 대한 최신 정보

엣지 컴퓨팅
엣지에서의 운영을 단순화하는 플랫폼 업데이트

인프라
세계적으로 인정받은 기업용 Linux 플랫폼에 대한 최신 정보

애플리케이션
복잡한 애플리케이션에 대한 솔루션 더 보기
가상화
온프레미스와 클라우드 환경에서 워크로드를 유연하게 운영하기 위한 엔터프라이즈 가상화의 미래