

In this series, we will introduce the observability features including monitoring, alerting, dashboards spanning the projects that comes with OpenShift, application projects that are deployed on OpenShift and the infrastructure resources that is supporting the cluster and in short focussed on the builtin features with in the OpenShift Container Platform (OCP). OpenShift Container Platform (OCP) is the leading hybrid cloud enterprise Kubernetes application platform.
OpenShift Platform Plus is a combination of OCP, ACM, ACS, Quay and ODF essentials is a superset and the associated observability features is deferred to the Part-2 in this series.
Current version of OCP right now is 4.13 and you can refer to this Red Hat OpenShift Observability Brings Flexible Insights to Management of Clusters to get a summary of the OCP Observability features introduced since 4.10.
Key Take aways in this blog:
- Overview of the observability features available in OCP.
- How to enable observability for user defined projects.
- How to configure a simple alert rule and configure a notification.
- Set of commonly used metrics for reference.
- Useful links to dive deep in to the possibilities.
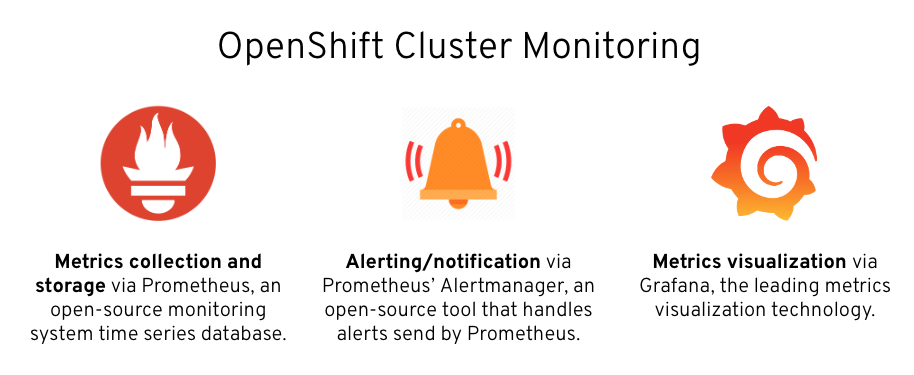
OpenShift Container Platform includes a pre-configured, pre-installed, and self-updating monitoring stack that is based on the Prometheus open source project and its wider ecosystem. It provides monitoring of cluster components and includes a set of alerts to immediately notify about any occurring problems and a set of Grafana dashboards.
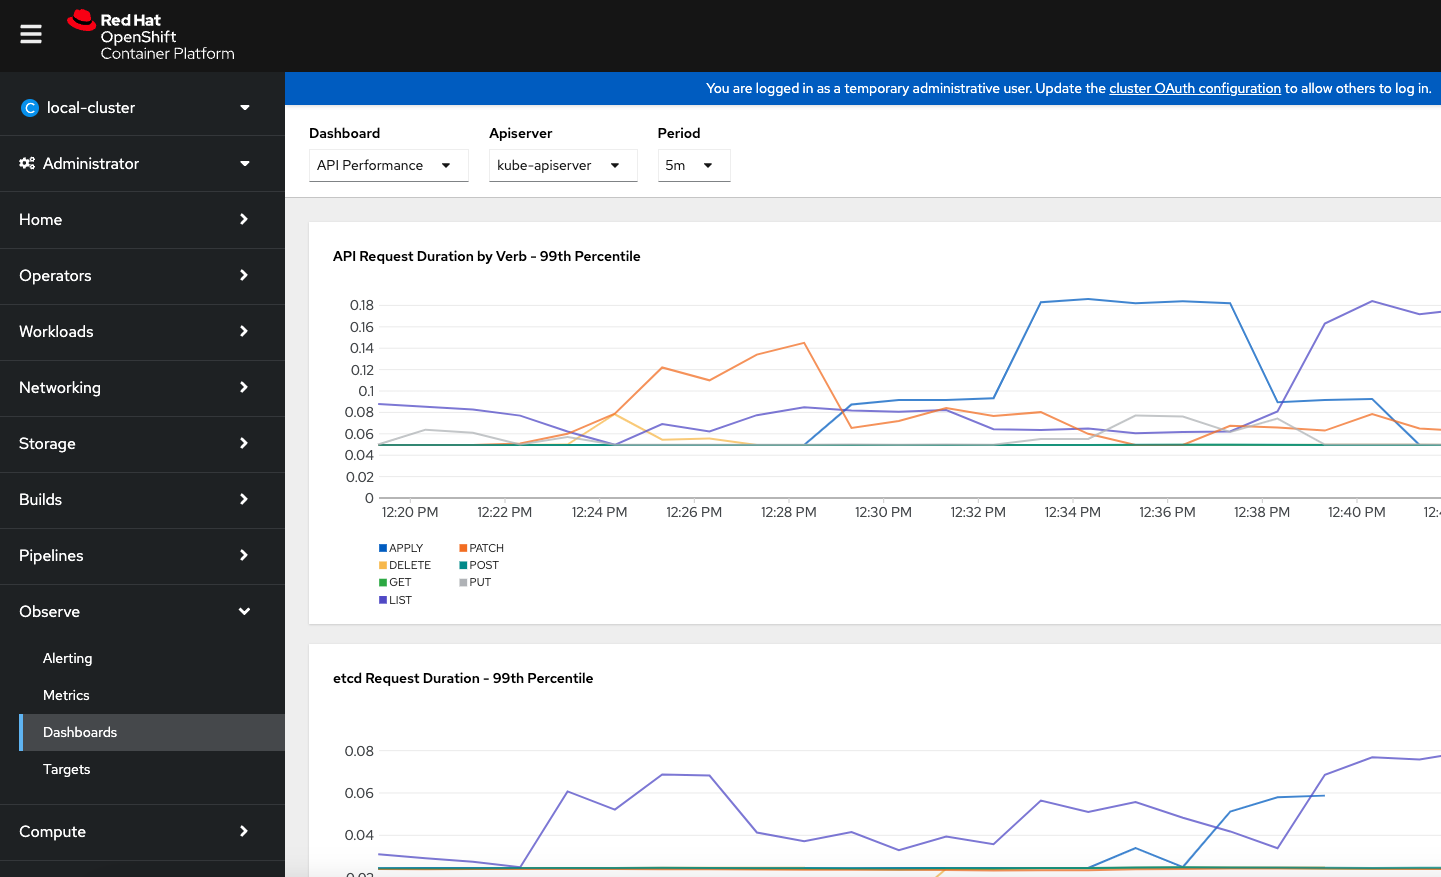
User Interface features can be seen under “Observe” options.
The point to be noted is that the OCP clusters automatically come with the certain set of preconfigured alert rules, dashboards and metrics based on the cluster features, additional configuration must be performed to enable these features for “user defined projects” which is pretty much any applications that run on top of the clusters. Good news is this is just a one time activity to be done on the cluster.
Now let us review the different Tabs under Observability.
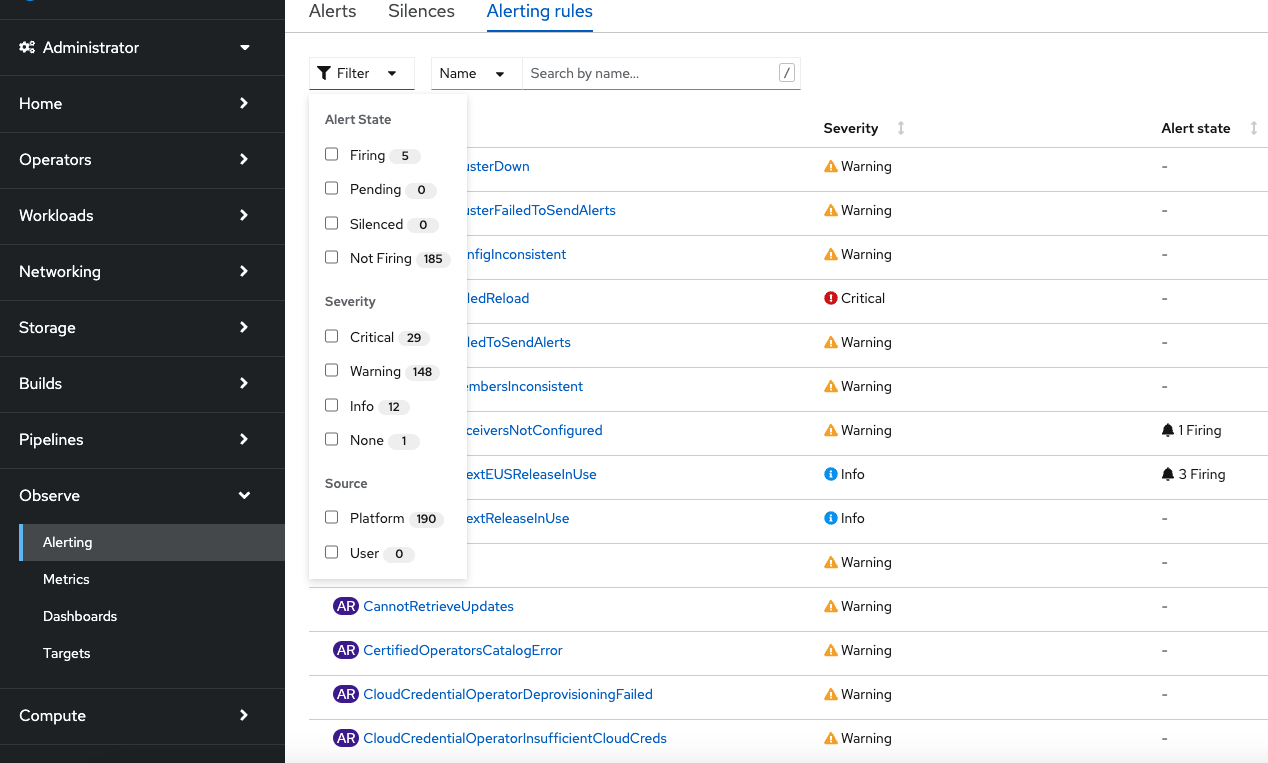
Alerting :
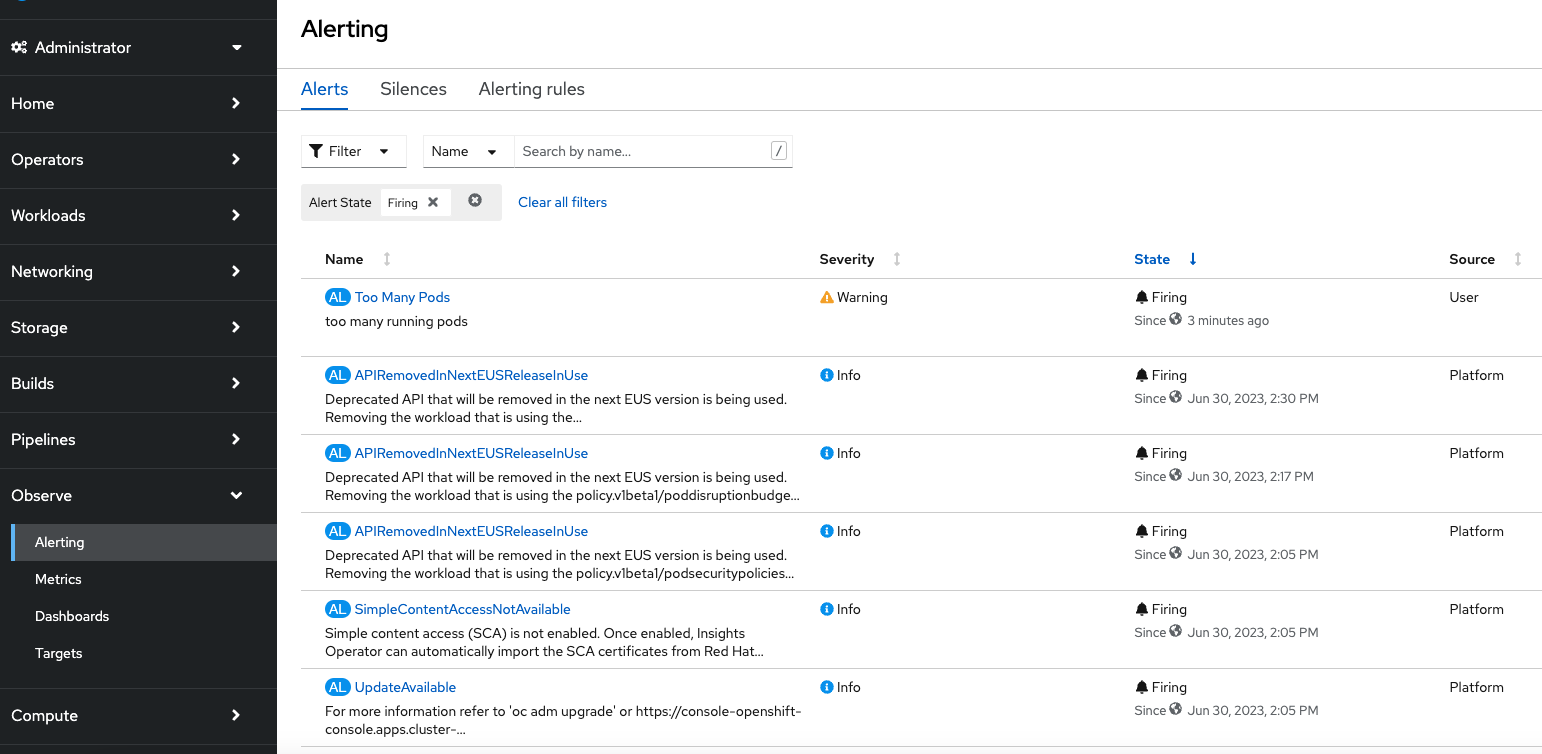
The Alerting tab shows you information about currently configured alerting rules and active alerts. As you can see the Alerting rules provides the flexibility to filter the rules by state, severity and source.
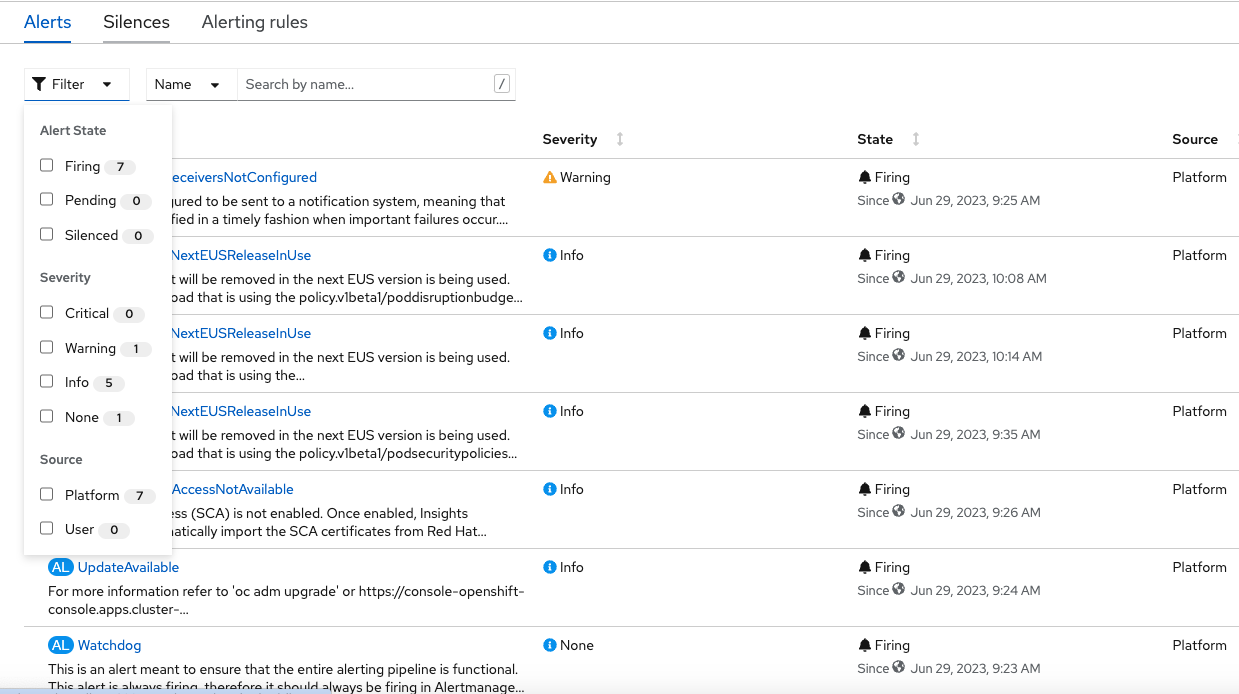
In the “Alerts” tab one can see the generated alerts and can filter at different states and severity.
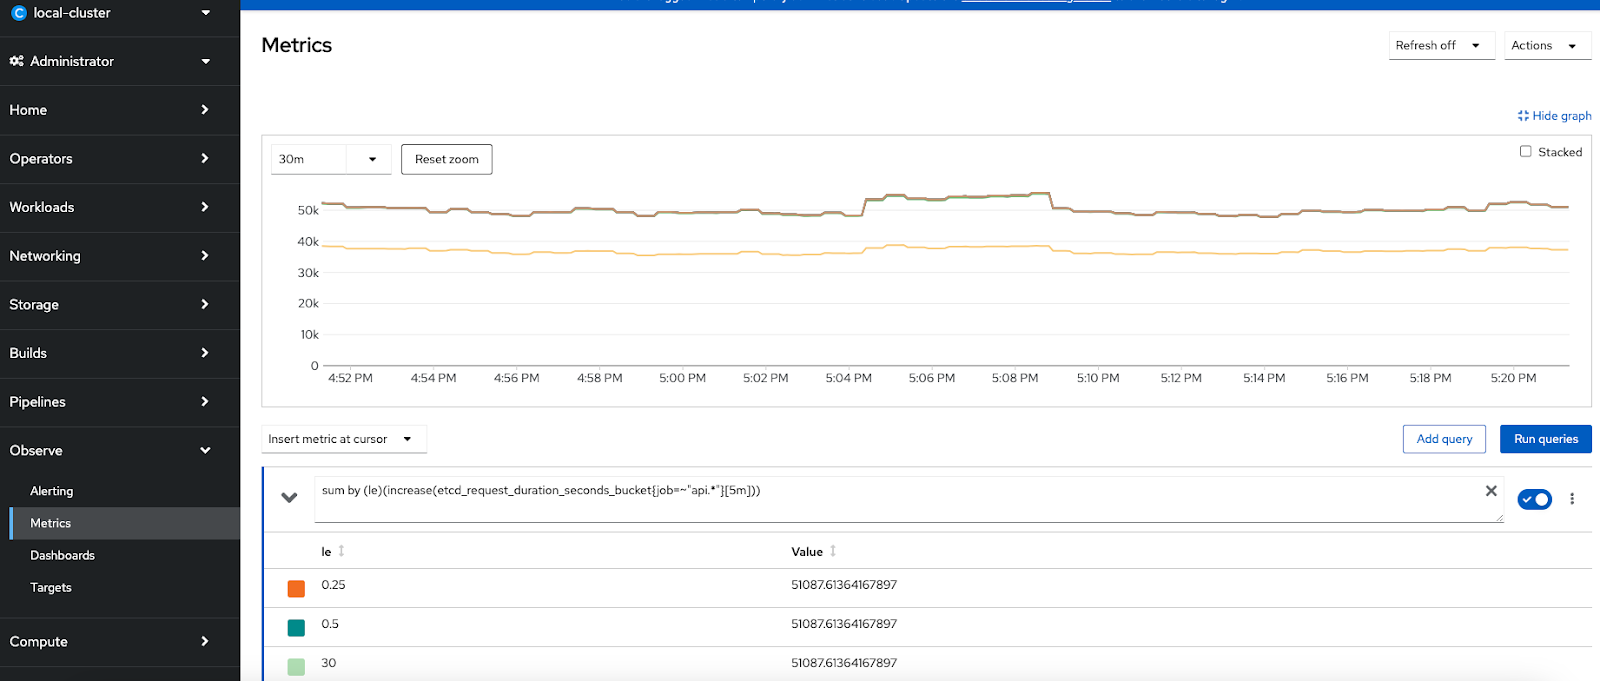
Metrics UI(Prometheus Console) :
In addition to the Alerting screen, OpenShift’s built-in monitoring provides an interface to access metrics collected by Prometheus using the Prometheus Query Language (PromQL). The "Metrics" menu provides a way develop custom queries against Prometheus/metrics to run or there is a long list of queries that are already included which can be used to make more custom dashboards.Providing two examples below and a set of key metrics is available in https://github.com/CastawayEGR/summit23-analyzing-key-metrics
Etcd Request Latency Query : sum by (le)(increase(etcd_request_duration_seconds_bucket{job=~"api.*"}[$__rate_interval]))
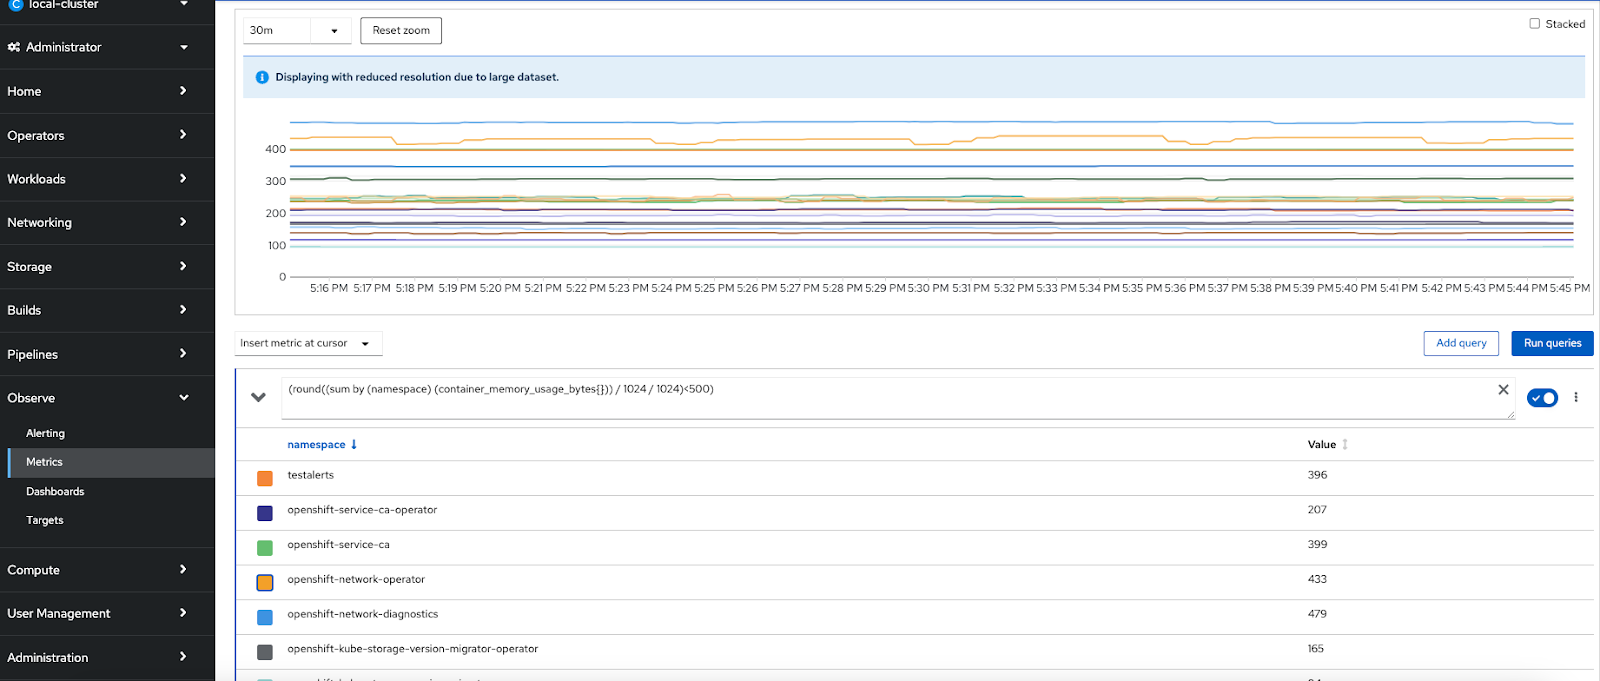
OpenShift Namespace Memory Usage
Query: round((sum by (namespace) (container_memory_usage_bytes{namespace=~"openshift-.*"})) / 1024 / 1024)
Now let us look at how to enable monitoring for the user defined projects
To configure core OpenShift Container Platform monitoring components, you must create the cluster-monitoring-config ConfigMap object in the openshift-monitoring project.
This can be done by using oc command after logging in to the cluster or can be done through web console. Through the web console, the following object definition can be used
apiVersion: v1
kind: ConfigMap
metadata:
  name: cluster-monitoring-config
  namespace: openshift-monitoring
data:
  config.yaml: |
    enableUserWorkload: true
Note: you can also create a file for this object and apply through the oc command.

This automatically creates the Prometheus workload and Thanos workload instances for the user defined projects under the openshift-user-workload-monitoring project as in this figure
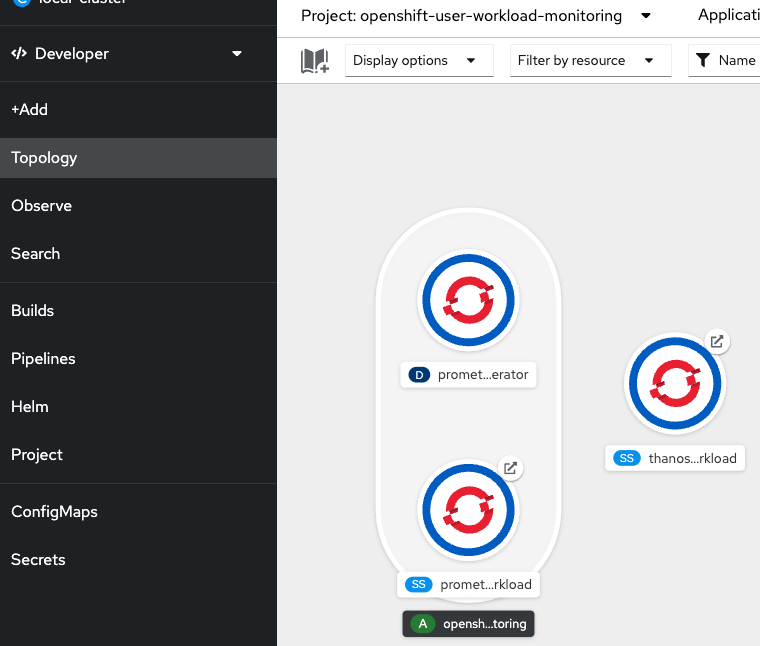
Creating a user-defined workload monitoring config map
This is an optional step but a best practice to be adopted to configure the components that monitor user-defined projects as seen in the above diagram, you must create the user-workload-monitoring-config ConfigMap object in the openshift-user-workload-monitoring project.
For both the components at the OpenShift Monitoring and user defined monitoring components it is possible to configure a number of important features such as configuring persistent storage, node selectors to move monitoring components, configuring metrics collection profiles and more…
Sample Alert rule creation scenario:
Create a project named “testalerts”
Create an application from the samples basic nodejs from the developers view on the console using default values.
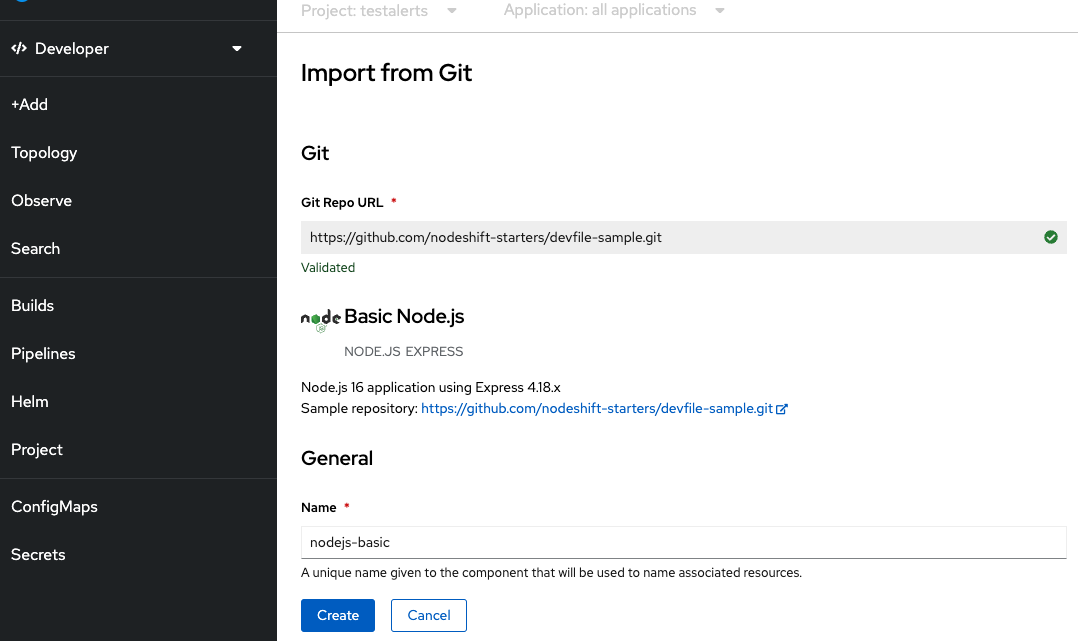
You can see the application is successfully created with the routes.
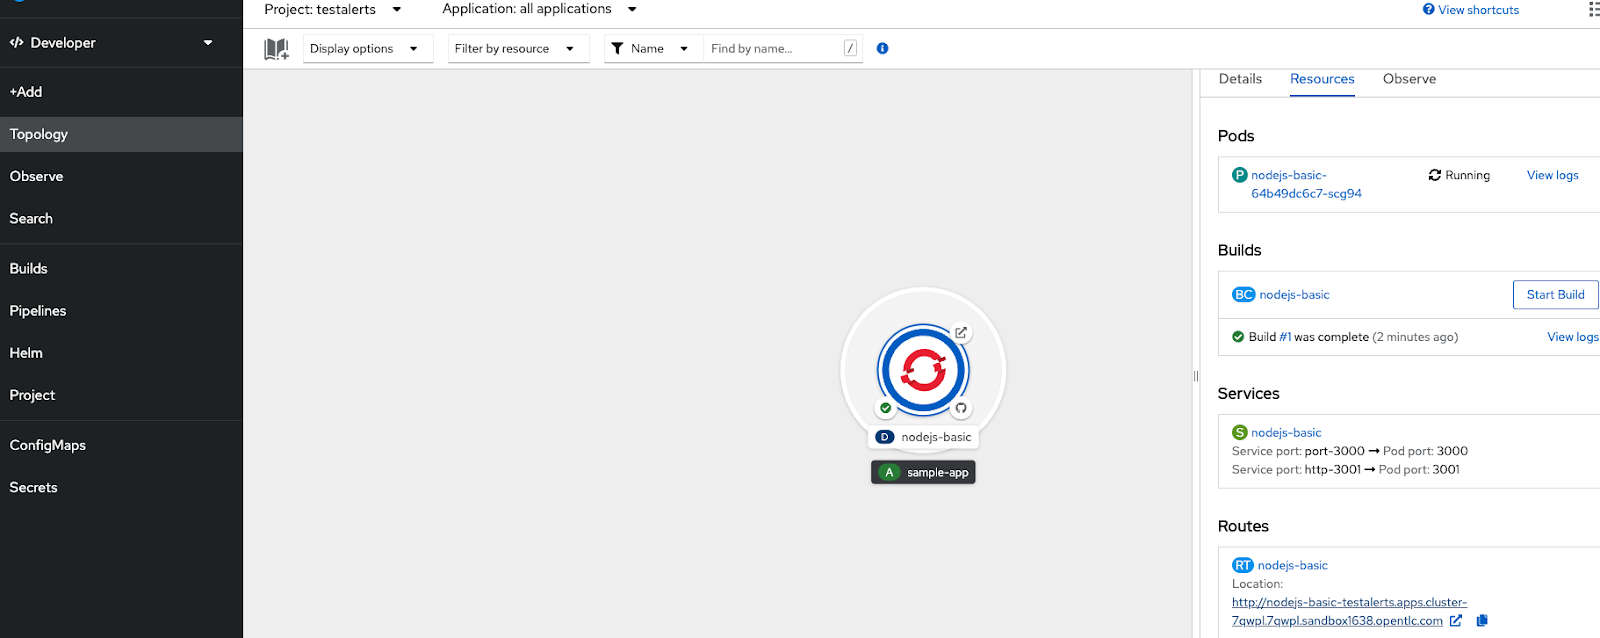
Execute the route couple of times to generate some observability metrics.
Now you can go to the Observe view of the project to review the available dashboards.

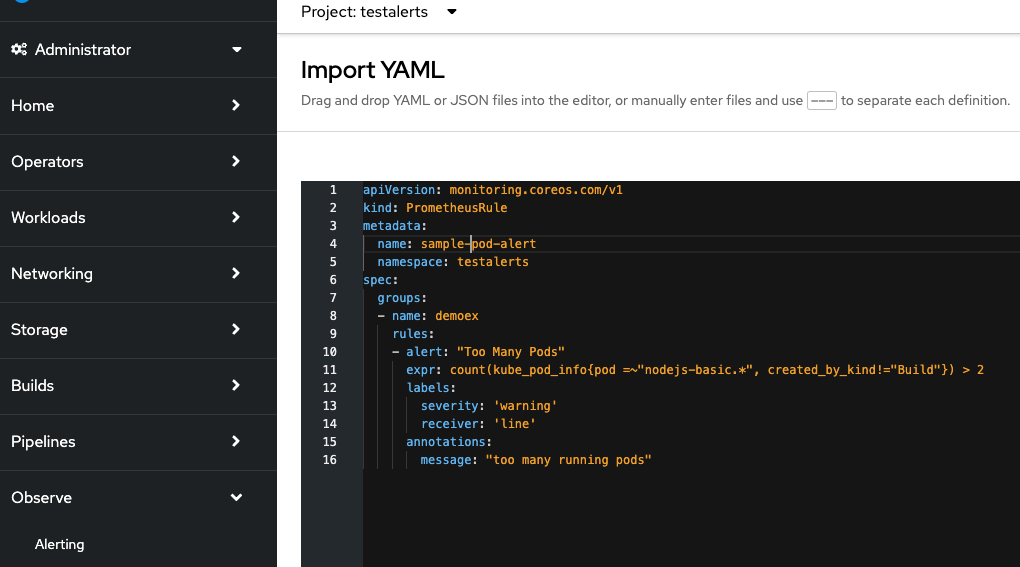
Now let us create a new Alert rule - This will create an alert if the number of running pods exceeds 2.
apiVersion: monitoring.coreos.com/v1
kind: PrometheusRule
metadata:
  name: pod-alert
  namespace: testalerts
spec:
  groups:
  - name: demoex
    rules:
    - alert: "Too Many Pods"
      expr: count(kube_pod_info{pod =~"nodejs-basic.*", created_by_kind!="Build"}) > 2
      labels:
        severity: 'warning'
        receiver: 'line'
      annotations:
        message: "too many running pods"
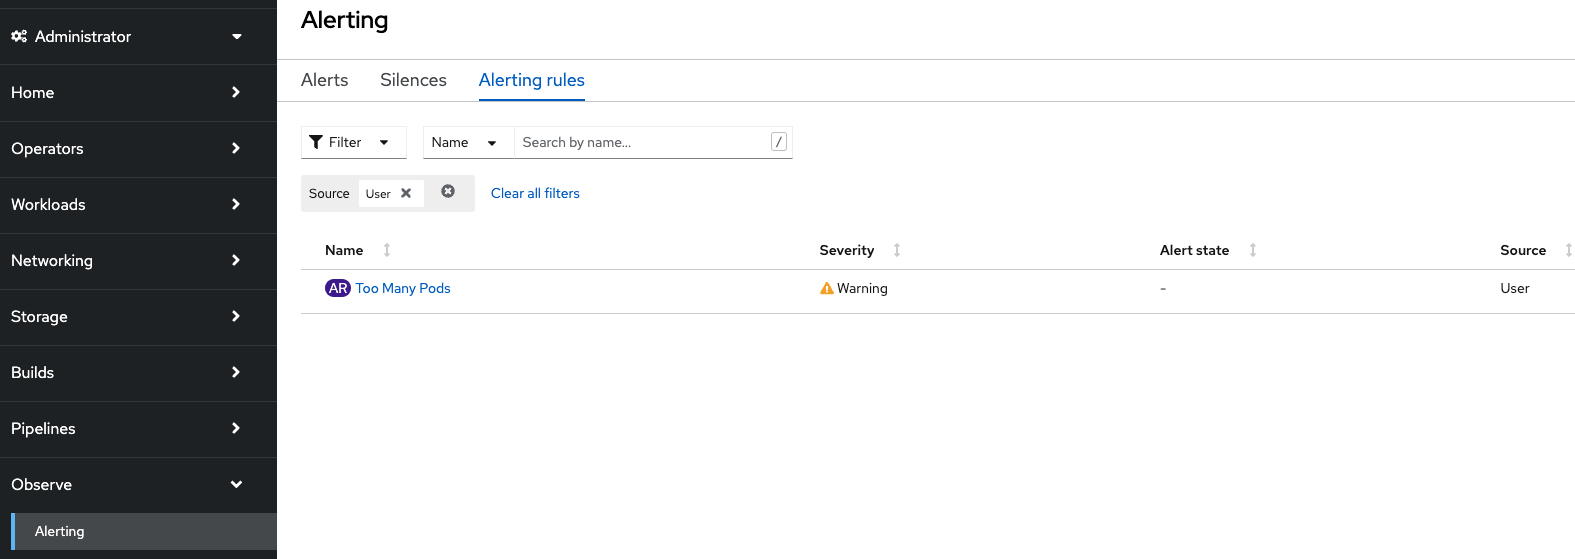
Now if you look at the Alert Rule tab you can this newly created “user” alert rule added
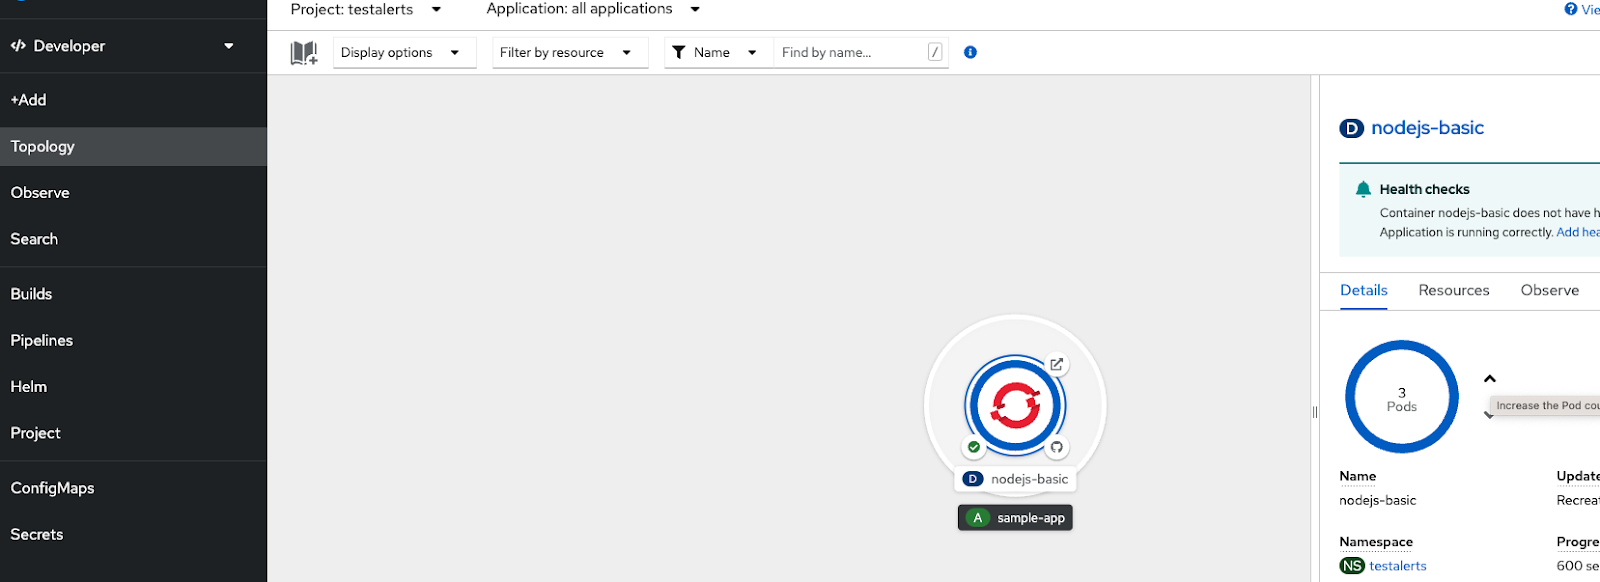
Now let us trigger the condition by increasing the running PODs to more than 2 to generate the Alert
Now you can see the generated “User” alert in the list of alerts
Go and reduce the number of running PODs to 1 or 2 , then the alert will stop firing and if you notice the Observe tab and look at the history for the last 5 minutes, you can see there is no current alert

Alerts can also be routed to different receivers such as email,slack channel, pager duty and Web hook. This can be defined in Administration→Cluster Settings→Configuration→Alertmanager

Reference for how to integrate Slack channel as a receiver - https://cloud.redhat.com/blog/how-to-integrate-openshift-namespace-monitoring-and-slack
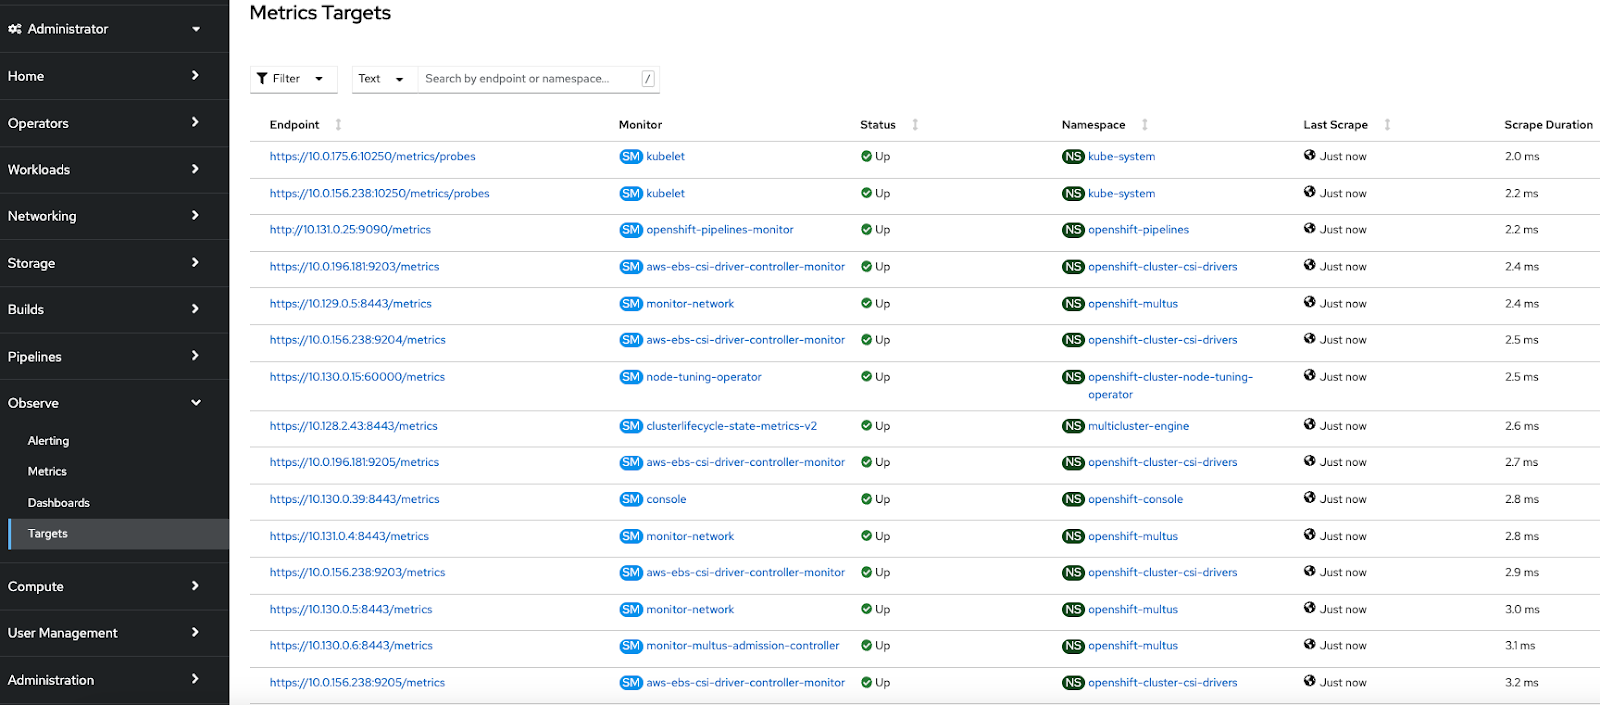
Metrics Targets :
OpenShift Container Platform Monitoring collects metrics from targeted cluster components by scraping data from exposed service endpoints. The Metrics Targets page shows targets for default OpenShift Container Platform projects and for user-defined projects.
At project level , specific dashboards, metrics, alerts and events can be observed.

Alert routing for user-defined projects
Conclusion
In this article, we presented how the observability features can be leveraged as available with the OpenShift platform by focusing on a simple alert. The majority of observability features can be both defined and managed not only by the cluster administrator but also by the users of the different projects. Some useful references are provided below to dive deep into these features.
Please reach out to your Red Hat account team to discuss further.
References:
- The five pillars of OpenShift Observability
- Enabling user defined monitoring - https://docs.openshift.com/container-platform/4.13/monitoring/enabling-monitoring-for-user-defined-projects.html
- Enable alert routing for user defined projects: https://access.redhat.com/documentation/en-us/openshift_container_platform/4.13/html-single/monitoring/index#understanding-alert-routing-for-user-defined-projects_enabling-alert-routing-for-user-defined-projects
- https://myopenshiftblog.com/openshift-observability/
- Managing alerts: https://access.redhat.com/documentation/en-us/openshift_container_platform/4.13/html-single/monitoring/index#managing-alerts
- Sending notifications: https://access.redhat.com/documentation/en-us/openshift_container_platform/4.13/html-single/monitoring/index#sending-notifications-to-external-systems_managing-alerts
- Custom monitoring and Alert - https://github.com/rhthsa/openshift-demo/blob/main/custom-alert.md
- Create custom alerts to monitor for project quotas with PrometheusRule quota-alert.yaml
- Example workload: https://examples.openshift.pub/deploy/monitoring/workload/
- Analyzing key metrics: https://github.com/CastawayEGR/summit23-analyzing-key-metrics
- https://github.com/cptmorgan-rh/ocp-cluster-review
- https://cloud.redhat.com/blog/whats-new-in-red-hat-openshift-monitoring-4.13-logging-5.7-and-distributed-tracing-2.8
- Subscribe to SE Synergy and Acceleration channel - https://www.youtube.com/channel/UCqMv_XDUDenRYi26UElraeg
저자 소개
Abay Radhakrishnan has more than 30 years of experience in the consulting, IT and software fields with focus on emerging technologies. He plays a unique combination of an enterprise architect and cloud strategy and solutions architect. As a technical management personnel, he has deep experience in defining, architecting, managing and implementing large-scale enterprise architectures and solutions.
I build real-world GenAI solutions for organizations that can’t afford to get it wrong.
My career spans national security, enterprise software, and next-generation AI platforms, with more than a decade focused on solving complex problems at the intersection of data, intelligence, and technology. I began in the intelligence community, serving eight years with the NSA and across the IC in intrusion defense, intelligence analysis, and mission-critical cyber operations. That experience in high-stakes security, pattern recognition, and adversarial thinking continues to shape how I approach GenAI strategy and deployment today.
Since then, I’ve led product and platform initiatives in digital ecosystems, advised startups, and worked across the data science landscape helping organizations move from experimentation to production. Much of my work focuses on making generative AI models more knowledgeable and reliable by grounding them in domain-specific data, mission context, and real operational constraints across national security, research, and healthcare.
Today, as an AI Solutions Advisor at Red Hat and IBM, I partner with government agencies, research institutions, and enterprises across North America to design scalable GenAI systems that work in the real world. The goal is never novelty — it’s better decisions, faster execution, and durable advantage.
유사한 검색 결과
Red Hat Enterprise Linux의 이미지 모드를 지금 바로 사용해야 하는 4가지 이유
강력한 보안, 즉시 사용 가능, 추가 비용 없이 제공: 컨테이너 보안의 진화
Container Roundup | Compiler
The Containers_Derby | Command Line Heroes
채널별 검색

오토메이션
기술, 팀, 인프라를 위한 IT 자동화 최신 동향

인공지능
고객이 어디서나 AI 워크로드를 실행할 수 있도록 지원하는 플랫폼 업데이트

오픈 하이브리드 클라우드
하이브리드 클라우드로 더욱 유연한 미래를 구축하는 방법을 알아보세요

보안
환경과 기술 전반에 걸쳐 리스크를 감소하는 방법에 대한 최신 정보

엣지 컴퓨팅
엣지에서의 운영을 단순화하는 플랫폼 업데이트

인프라
세계적으로 인정받은 기업용 Linux 플랫폼에 대한 최신 정보

애플리케이션
복잡한 애플리케이션에 대한 솔루션 더 보기
가상화
온프레미스와 클라우드 환경에서 워크로드를 유연하게 운영하기 위한 엔터프라이즈 가상화의 미래