In a previous article, I introduced Elasticsearch, Logstash, and Kibana (the ELK Stack) and the various components that make up this monitoring system. In this article, I'll look at how I use the ELK Stack to monitor my Nginx web server. This requires approximately 16GB of memory to operate.
As I wrote before, "Elasticsearch is the engine of the Elastic Stack, which provides analytics and search functionalities. Logstash is responsible for collecting, aggregating, and storing data to be used by Elasticsearch. Kibana provides the user interface and insights into data previously collected and analyzed by Elasticsearch."
Here, I'll introduce the concepts and basic configurations for how I use the ELK Stack to monitor my web server. Please note that these steps are not very detailed; I use this for development and demonstration rather than production. Running ELK in production would involve multiple instances in a cluster.
This tutorial uses Elasticsearch and Kibana; Logstash supports many modules by default, and you can tap into this information.
Step 1: Deploy Elasticsearch and Kibana
To make deployment easy, I created an application stalk with Elasticsearch and Kibana using Podman. Here is the pod and two containers:
podman pod create --name elastic -p 9200:9200 -p 9300:9300 -p 5601:5601
podman run --pod elastic --name elasticsearch -d -e "discovery.type=single-node" docker.elastic.co/elasticsearch/elasticsearch:7.14.0
podman run --pod elastic --name kibana -d -e "ELASTICSEARCH_HOSTS=http://127.0.0.1:9200" docker.elastic.co/kibana/kibana:7.14.0
This creates a pod named elastic and two containers within the pod:
- An
elasticsearchcontainer, which runs the imagedocker.elastic.co/elasticsearch/elasticsearch:7.14.0. - A
kibanacontainer, which runs the imagedocker.elastic.co/kibana/kibana:7.14.0and connects to theelasticsearchcontainer onport 9200.
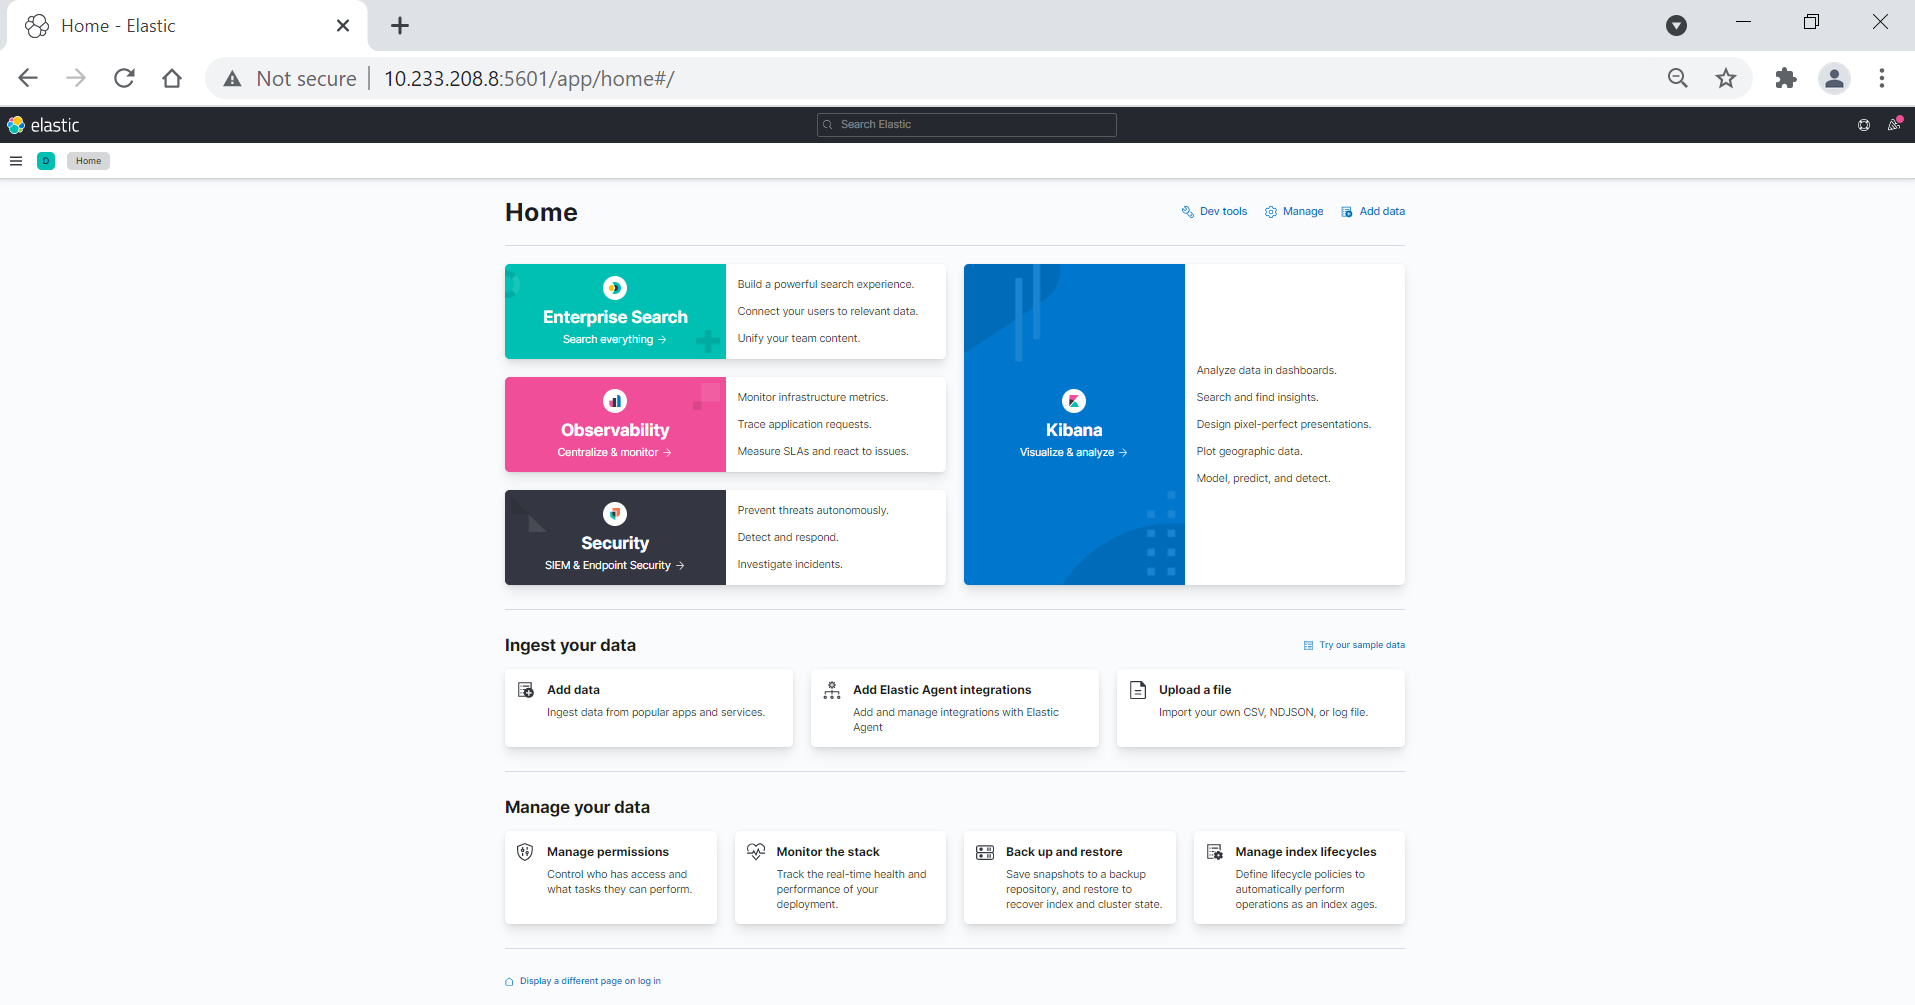
If these run successfully, the Kibana dashboard is accessible from the host browser. The firewall must allow port 5601, which is used for accessing Kibana, for external access.
To run this tutorial on a local machine, use http://localhost:5601 to access the dashboard; to run it inside a virtual machine (VM), use the VM's IP address. Port forwarding uses the same steps as running it on localhost.
[ Free online course: Developing cloud-native applications with microservices architectures. ]
I use this path to access the Nginx logs from the main page:
Home page -> Add data -> Logs -> nginx logsStep 2: Configure the Filebeat and Nginx module
According to Elastic, "Filebeat monitors the log files or locations that you specify, collects log events, and forwards them either to Elasticsearch or Logstash for indexing." The Nginx logs page explains how to configure Filebeat and the Nginx module. This configuration displays the Kibana entries on the server where Nginx is installed and sends the Nginx logs to Elasticsearch:
curl -L -O https://artifacts.elastic.co/downloads/beats/filebeat/filebeat-7.14.0-x86_64.rpm
rpm -vi filebeat-7.14.0-x86_64.rpm
I modify /etc/filebeat/filebeat.yml to set the connection information:
output.elasticsearch:
  hosts: ["10.233.208.8:9200"] #This is server in where elasticsearch is running
setup.kibana:
  host: "10.233.208.8:5601" #This is the server where kabana is running

#check if filebeat file has the correct syntax:
filebeat -e -c /etc/filebeat/filebeat.yml

#Enable the nginx module
filebeat modules enable nginx

#configure filebeat to start and persist reboot:
filebeat setup
systemctl enable filebeat
systemctl start filebeat
Step 3: Create an index pattern on Elasticsearch
Kibana requires an index pattern in order to search the data that Elasticsearch processes. An index pattern identifies the data to use and the metadata or properties of the data. This is analogous to selecting specific data from a database.
On Kibana's main page, I use this path to create an index pattern:
Management -> Stack Management -> index patterns -> create index patternI enter the index pattern, such as filebeat-*. It suggests choices, and a wildcard works to match multiple sources.
Click Next.
If Kibana detects an index with a timestamp, I expand the Time field menu and specify the default field for filtering data by time.
[ Learn more about server and configuration management by downloading Ansible for DevOps. ]
Step 4: Create a dashboard to visualize data
I follow this path to display a data visualization:
Main Page -> Analytics -> Dashboard -> create visualizationOn the left, I select the Available fields and use the dropdown on the right to create a dashboard.
Learn more
This container-based deployment option for the ELK Stack is particularly useful in a lab or learning scenario. There are plenty of additional configurations available to monitor servers.
The ELK Stack is a comprehensive tool that sysadmins may find useful for real-time monitoring and analytics. It can also be integrated into other systems. If you want to go beyond this introduction of these basic concepts and configurations and use it in a production deployment, consult the documentation.
Sobre o autor

I work as Unix/Linux Administrator with a passion for high availability systems and clusters. I am a student of performance and optimization of systems and DevOps. I have passion for anything IT related and most importantly automation, high availability, and security.
Mais como este
Take your automation to the next level with Ansible Content Collections for Windows, Splunk, AIOps, MCP, and more
Automating the modern network: A Q1 network automation recap
Technically Speaking | Taming AI agents with observability
You Can't Automate Buy-In | Code Comments
Navegue por canal

Automação
Últimas novidades em automação de TI para empresas de tecnologia, equipes e ambientes

Inteligência artificial
Descubra as atualizações nas plataformas que proporcionam aos clientes executar suas cargas de trabalho de IA em qualquer ambiente

Nuvem híbrida aberta
Veja como construímos um futuro mais flexível com a nuvem híbrida

Segurança
Veja as últimas novidades sobre como reduzimos riscos em ambientes e tecnologias

Edge computing
Saiba quais são as atualizações nas plataformas que simplificam as operações na borda

Infraestrutura
Saiba o que há de mais recente na plataforma Linux empresarial líder mundial

Aplicações
Conheça nossas soluções desenvolvidas para ajudar você a superar os desafios mais complexos de aplicações
Virtualização
O futuro da virtualização empresarial para suas cargas de trabalho on-premise ou na nuvem