
Detection is only half the process. Swift remediation is what keeps operations smooth. Yet for many site reliability engineers (SREs), on-call shifts are spent trapped in a loop of repetitive firefighting. Pairing Splunk Observability Cloud with Red Hat Ansible Automation Platform helps bridge the gap between discovery and response, transforming manual triage into safer, automated self-healing that reduces mean time to resolution (MTTR).
The architecture
AIOps uses operational alerts to automate routine operational tasks. For example, when Splunk Observability Cloud detects a memory leak, a certificate nearing expiration, or an application throwing errors, Ansible Automation Platform can execute the same remediation steps an engineer would, such as restarting a service, scaling a deployment, or rotating a credential, in seconds instead of hours.
Four components form the pipeline:
- Splunk OpenTelemetry Collector: Gathers metrics, traces, and logs from your hosts, containers, and Kubernetes clusters, routing them directly to Splunk Observability Cloud.
- Splunk Observability Cloud: Aggregates metrics, traces, and logs, applying AI-driven detectors to catch performance degradation before users do.
- Webhook: Sends Splunk alerts as structured event payloads to Ansible Automation Platform either as native webhooks or through the Splunk add-on for Event-Driven Ansible.
- Ansible Automation Platform: Receives events through the Event-Driven Ansible feature, matches them against a rulebook, and executes remediation playbooks with full role-based access control (RBAC) and audit trails.
Deploy and manage collectors at scale with Splunk OTel and Ansible Automation Platform
Managing 1 collector on a test box is easy. Deploying hundreds across a hybrid fleet with consistent pipelines and configs is where manual work falls apart.
The Splunk OpenTelemetry (OTel) Collector simplifies this process by acting as your universal telemetry agent, gathering data from hosts, containers, and applications, and routing it cleanly to Splunk Observability Cloud. The cisco.splunk_otel_collector Ansible Content Collection (available on Ansible automation hub) handles the full lifecycle:
- Deploy across Linux, Windows, and container environments in a single run.
- Configure receivers, processors, and exporters consistently fleet-wide.
- Update with controlled batching and canary strategies.
- Validate collectors are healthy and reporting post-deployment.
Ansible Automation Platform is the governed execution layer that uses RBAC for sensitive configurations, scheduled rollouts, credential vaulting, and simplified surveys. This allows operators to customize deployments without editing playbook code, turning a high-stress, manual rollout into a predictable, repeatable, and trusted operation.
What Splunk Observability Cloud monitors
With collectors deployed, Splunk Observability Cloud provides correlated visibility across the full environment:
- Infrastructure Monitoring: Host and container metrics from the OTel collectors (CPU, memory, disk, and network) with real-time dashboards and alerts.
- Application Performance Monitoring (APM): Distributed traces across services, mapping dependencies, and surfacing latency bottlenecks.
- Log Observer Connect: Logs correlated with metrics and traces so operators get full context without switching tools.
- Real User Monitoring (RUM): Frontend performance from real user sessions including page loads, JavaScript errors, and experience degradation caused by backend changes.
- Synthetic Monitoring: Proactive availability and performance tests from external vantage points, catching outages before users report them.
- On-Call and Incident Response: Alert routing and incident workflows.
These observability signals aren't just for dashboards, they serve as the triggers for automated remediation downstream.
From alert to remediation: How the loop works
Here's what this looks like in practice with a memory capacity alert example.
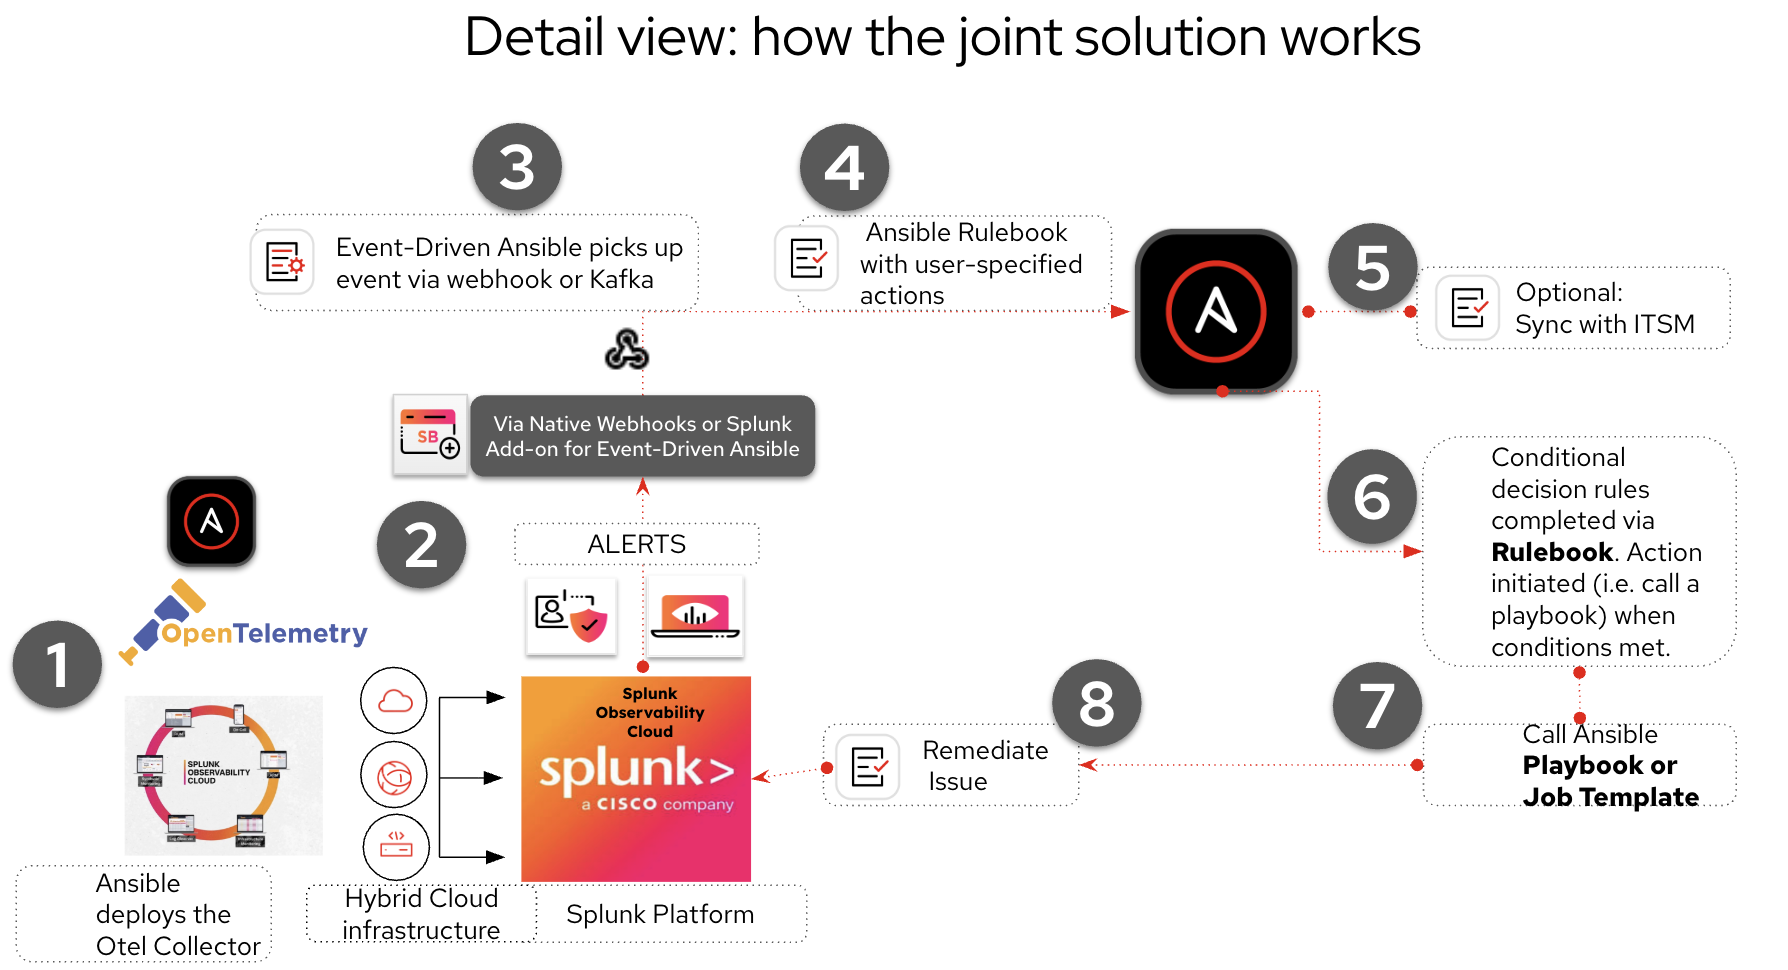
- Deploy and detect. Ansible Automation Platform deploys the Splunk OTel Collector. Memory on your application servers crosses 90%. Splunk Observability Cloud sees garbage collection pause times climbing and response latency rising, firing an alert.
- Event forwarding. The webhook sends the alert payload (hostnames, memory values, severity) directly to Ansible Automation Platform as a structured event.
- Event received. The Event-Driven Ansible feature included in Ansible Automation Platform picks up the event.
- Rule matching. Ansible Automation Platform evaluates the event against your existing, pre-approved Ansible Rulebooks.
- ITSM sync (optional). Before running the fix, Ansible Automation Platform can create and update IT service management (ITSM) tickets via ITSM integration using the platform API. Once the automation runs, the ticket is updated and closed if successful.
- Rule evaluation. Once approved (or automatically validated by policy), the rulebook passes alert context, such as hostnames and breached thresholds, directly into the remediation playbook.
- Execute with approval. The Ansible Playbook or job template is called. This step can include a human-in-the-loop (HITL) where an engineer's approval is required.
- Remediate. The Ansible Playbook or job template runs and safely restarts the application process with a rolling strategy, 1 host at a time, validating health checks between each restart. If the remediation fails (for example, if memory use spikes again within minutes), a different rule is activated. This immediately escalates the incident to the on-call engineer using the ITSM platform, providing full context on what was tried, the automated results, and the current state of the environment.
What about the playbook you don't have yet?
Not every outage has a pre-built playbook waiting. With AI-assisted authoring tools, whether an automation coding assistant (a feature within Ansible Automation Platform), the Model Context Protocol (MCP) server for Ansible Automation Platform, or a team's own large language model (LLM) tooling such as OpenAI or Claude, engineers can describe remediation steps with a natural language prompt and generate targeted Ansible Automation Platform tasks in seconds. This empowers additional teams to use automation and accelerates productivity.
Getting started
- Instrument: Access the cisco.splunk_otel_collector Ansible Content Collection available on Ansible automation hub as part of your Ansible Automation Platform subscription.
- Observe: Configure Splunk Observability Cloud detectors for your critical services. Wire Ansible Automation Platform's own telemetry into Splunk so automation health is also visible.
- Automate: Download the Splunk Add-on for Event-Driven Ansible on Splunkbase or create lightweight webhooks to automate your landscape. You can explore sample rulebooks to start automating your operational workflows.
Resources
- Connect with Red Hat at Splunk .conf26: Visit us in booth #3 to watch live demos, talk with our experts, and see how closed-loop automation brings real-time resilience across your stack.
- Learn more: Explore AIOps automation with Red Hat Ansible Automation Platform for interactive demos and partner integrations.
- Watch the webinar: AIOps: Observe and automate your tech stack with Red Hat and Splunk covers how to progress across a journey to full automated response in an AIOps model.
- Explore the guides: The AIOps solution guides walk through partner-specific integrations from event-driven remediation to ticket enrichment.
- Start a conversation: If you're scoping an AIOps strategy or want help mapping your AIOps investments to govern automation, contact a Red Hatter today.
저자 소개
Stephen Fulmer is a Product Manager at Red Hat, leading Ansible content strategy. With a background in virtualization and IT operations, he works closely with customers, partners, and engineering teams to deliver trusted, scalable automation content for platforms like OpenShift, Windows, and public cloud. Stephen is passionate about enabling organizations to simplify complex workflows and accelerate their automation journeys with Red Hat Ansible Automation Platform.
유사한 검색 결과
Red Hat Ansible 올스타: 네트워크 및 인프라 자동화의 미래를 주도합니다
Ansible Automation Platform을 위한 새로운 오토메이션 오케스트레이터로 IT 워크플로우를 규모에 맞게 통합
Random Acts Of Automation | Compiler
Untangling Networks | Compiler
자세히 알아보기
E-book: 기업 자동화영어 (English) 버전으로 제공됩니다 (한국어 미지원) - 체험: 자기 주도식 핸즈온 랩으로 구성된 Red Hat Ansible Automation Platform
- Red Hat Ansible Automation Platform: 초보자 가이드
채널별 검색

오토메이션
기술, 팀, 인프라를 위한 IT 자동화 최신 동향

인공지능
고객이 어디서나 AI 워크로드를 실행할 수 있도록 지원하는 플랫폼 업데이트

오픈 하이브리드 클라우드
하이브리드 클라우드로 더욱 유연한 미래를 구축하는 방법을 알아보세요

보안
환경과 기술 전반에 걸쳐 리스크를 감소하는 방법에 대한 최신 정보

엣지 컴퓨팅
엣지에서의 운영을 단순화하는 플랫폼 업데이트

인프라
세계적으로 인정받은 기업용 Linux 플랫폼에 대한 최신 정보

애플리케이션
복잡한 애플리케이션에 대한 솔루션 더 보기

가상화
온프레미스와 클라우드 환경에서 워크로드를 유연하게 운영하기 위한 엔터프라이즈 가상화의 미래
