With the recently released Red Hat Enterprise Linux (RHEL) 9.6 and 10, a new functionality becomes available: pcp xsos. Performance Co-Pilot (PCP) has been part of RHEL for a long time.
PCP xsos can provide a convenient system overview:
- Of the currently running system.
- And of other systems, based on their PCP archive files.
Pcp xsos was created to improve our ability to debug customer issues more effectively. In Red Hat support, this starts with reviewing SOS reports that contain pieces from many corners of the customer's system. When PCP was running and configured to record the system's metrics, then the SOS report contains the most recent archive files, allowing us to run “pcp xsos” and obtain a system overview.
Basic pcp xsos usage
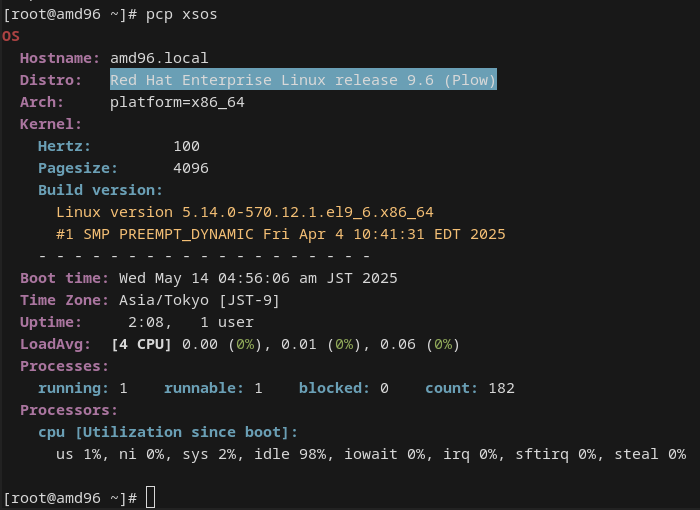
Let’s start with the live system. We will install the package pcp-zeroconf, which pulls in essential PCP dependencies, configures the services and starts the pmcd daemon.
# dnf -y install pcp-zeroconf pcp-system-tools
This provides us with an overview of the running system:
Under the hood, this command is contacting the pmcd daemon and composing the overview for us. Instead of using metrics from the running pmcd, we receive the output based on PCP archive files:
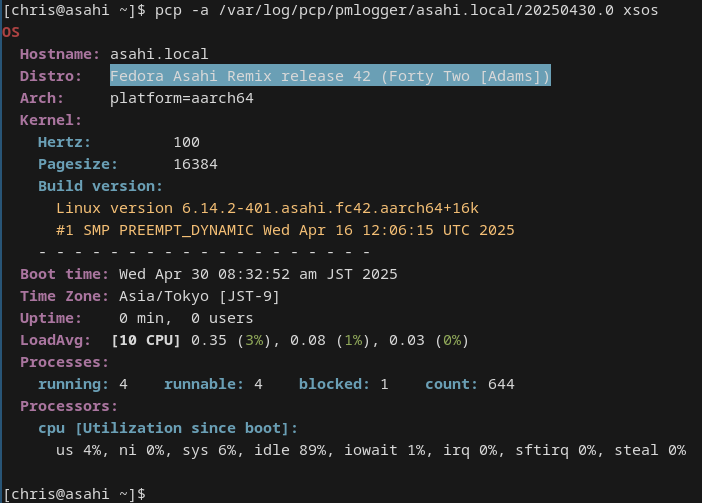
PCP archives are portable, allowing users to cross architectures. For example, they allow us to use an x86-64 system to analyze archive files from aarch64 or s390x systems. Without pcp xsos, we would have to dig in various places of the sos report to obtain this overview.
When we installed the package pcp-zeroconf, the pmlogger service was enabled and configured with detailed settings to create a historical record of metrics. The archive files are available below /var/log/pcp/pmlogger/<systemname>.
The pcp xsos functionality is part of the pcp-system-tools package, which is available on RHEL 9.6, RHEL 10 and Fedora. However, pcp xsos is designed for flexibility and can analyze performance data collected from older RHEL versions as well, such as RHEL 7 or RHEL 8. As long as the PCP archive files from the older systems contain the necessary performance metrics, pcp xsos can process them and provide the system overview.
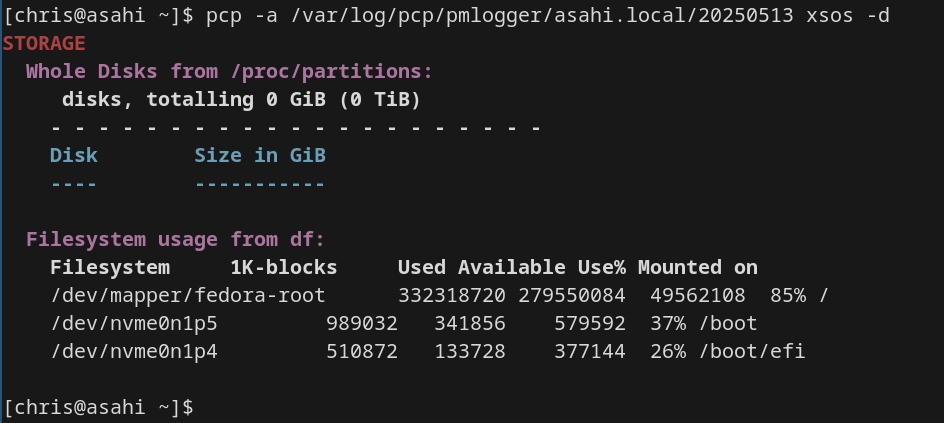
Using the -d parameter, we can also obtain storage details:
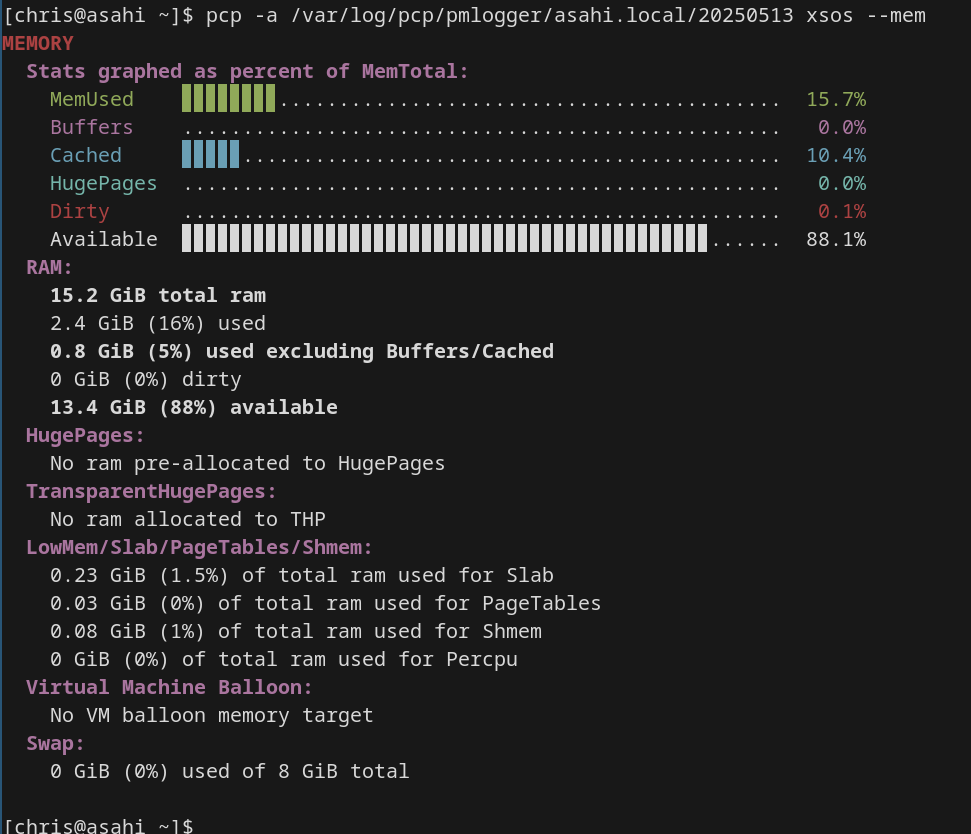
Also, using -mem, we can obtain memory details:
Further options for pcp xsos include:
- Network interface statistics like interface errors via ‘--netdev’
- Generic netstats via ‘--netstat’
- Process statistics via ‘-p’
Conclusion
The pcp xsos functionality on RHEL is a powerful tool for administrators and engineers to better support customers’ debugging issues.
- The upstream repo is at https://github.com/performancecopilot/xsos-pcp.
- The Red Hat product documentation has many details on PCP.
- Read the article: How to solve performance mysteries with Performance Co-Pilot on Red Hat Enterprise Linux
제품 체험판
Red Hat Enterprise Linux | 제품 체험판
저자 소개

Christian Horn is a Senior Technical Account Manager at Red Hat. After working with customers and partners since 2011 at Red Hat Germany, he moved to Japan, focusing on mission critical environments. Virtualization, debugging, performance monitoring and tuning are among the returning topics of his daily work. He also enjoys diving into new technical topics, and sharing the findings via documentation, presentations or articles.

Nathan is an engineer in Red Hat's Platform Tools group, leading the Grafana and PCP team.
유사한 검색 결과
장기적인 안정성 지원: Red Hat Enterprise Linux Extended Life Cycle, Premium 출시
Red Hat Universal Base Image (다시) 소개
OS Wars_part 1 | Command Line Heroes
OS Wars_part 2: Rise of Linux | Command Line Heroes
채널별 검색

오토메이션
기술, 팀, 인프라를 위한 IT 자동화 최신 동향

인공지능
고객이 어디서나 AI 워크로드를 실행할 수 있도록 지원하는 플랫폼 업데이트

오픈 하이브리드 클라우드
하이브리드 클라우드로 더욱 유연한 미래를 구축하는 방법을 알아보세요

보안
환경과 기술 전반에 걸쳐 리스크를 감소하는 방법에 대한 최신 정보

엣지 컴퓨팅
엣지에서의 운영을 단순화하는 플랫폼 업데이트

인프라
세계적으로 인정받은 기업용 Linux 플랫폼에 대한 최신 정보

애플리케이션
복잡한 애플리케이션에 대한 솔루션 더 보기
가상화
온프레미스와 클라우드 환경에서 워크로드를 유연하게 운영하기 위한 엔터프라이즈 가상화의 미래