
Prometheus is one of the fastest Cloud Native Computing Foundation projects being adopted. And now it comes as a native product in the OpenShift stack. It gives you everything that a good enterprise monitoring tool needs in one place: Good API, easy integration, time series database, real-time data, alerting, and flexibility. And having good visibility into your cluster state is one of the most important things about operating a distributed system.
In this guide, we will configure OpenShift Prometheus to send email alerts. In addition, we will configure Grafana dashboard to show some basic metrics. All components—Prometheus, NodeExporter, and Grafana—will be created in the separate projects. Prometheus web UI and AlertManager UI will be used only for configuration and testing. Our OpenShift cluster already has Prometheus deployed using Ansible Playbooks.
Ansible Playbook will create 1 pod with 5 containers running. This will change in the future when the HA solution for Prometheus and AlertManager is developed. But for now, this will do :)
We will deploy node-exporter so we can have some node level metrics too.
oc adm new-project openshift-metrics-node-exporter --node-selector='zone=az1'

oc project openshift-metrics-node-exporter

oc create -f https://raw.githubusercontent.com/openshift/origin/master/examples/prometheus/node-exporter.yaml -n openshift-metrics-node-exporter

oc adm policy add-scc-to-user -z prometheus-node-exporter -n openshift-metrics-node-exporter hostaccess
To deploy Grafana we will use an already existing project from mrsiano github project.
git clone https://github.com/mrsiano/grafana-ocp

cd grafana-ocp

./setup-grafana.sh prometheus-ocp openshift-metrics true
To configure Grafana to consume Prometheus, we will link grafana and openshift-metrics projects:
oc adm pod-network join-projects --to=grafana openshift-metrics
For the authentication read management-admin service account token:
oc sa get-token management-admin -n management-infra
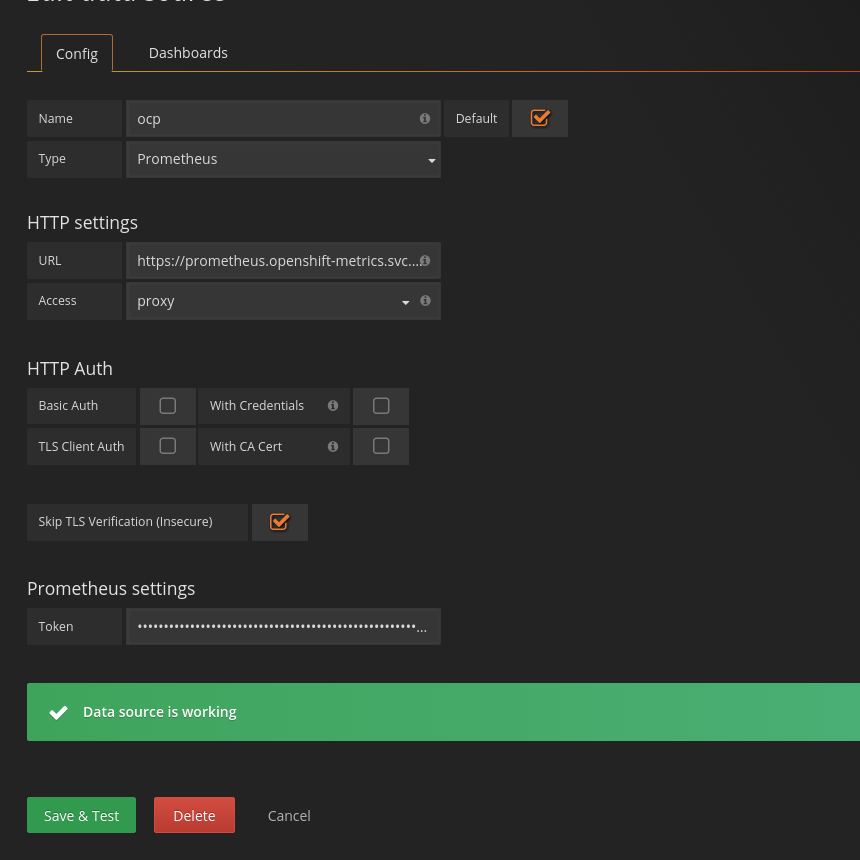
Login to the Grafana dashboard and add new source:
https://prometheus.openshift-metrics.svc.cluster.local
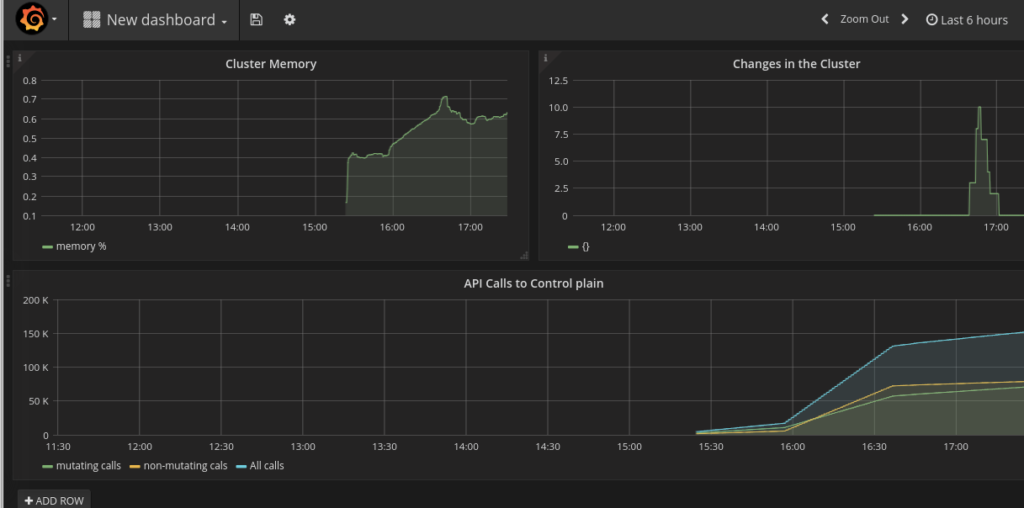
Example queries were taken from OpensShift Git repository.
- For cluster memory:
sum(container_memory_rss) / sum(machine_memory_bytes) - For changes in the cluster:
sum(changes(container_start_time_seconds[10m])) - For API calls:
sum(apiserver_request_count{verb=~"POST|PUT|DELETE|PATCH"}[5m])andsum(apiserver_request_count{verb=~"GET|LIST|WATCH"}[5m])
Next, we will configure the alerts and mail client. For mail messages, I will use mailjet.com as it gives an easy way to send mail via SMTP.
Now the alert manager is not exposed to outside world, so we will expose it temporarily in order to see alerts being generated.
cat <<EOF | oc create -n openshift-metrics -f -

apiVersion: v1

kind: Service

metadata:

 labels:

   name: alertmanager

 name: alertmanager

 namespace: openshift-metrics

spec:

 ports:

 - port: 8080

   protocol: TCP

   targetPort: 9093

 selector:

   app: prometheus

 sessionAffinity: None

 type: ClusterIP

status:

 loadBalancer: {}

EOF
oc expose service alertmanager -n openshift-metrics
 route="$(oc get routes -n openshift-metrics alertmanager --template='{{ .spec.host }}')"
 echo "Try accessing $route"
We need to modify Prometheus configMap to enable our new rules for alerts. We execute oc edit cm prometheus and add this:
prometheus.rules: |

   groups:

   - name: example-rules

     interval: 30s # defaults to global interval

     rules:

     - alert: "Node Down"

       expr: up{job="kubernetes-nodes"} == 0

       annotations:

         miqTarget: "ContainerNode"

         severity: "ERROR"

         url: "https://www.example.com/node_down_fixing_instructions"

         message: "Node {{$labels.instance}} is down"

     - alert: "Too Many Pods"

       expr: sum(kubelet_running_pod_count) > 15

       annotations:

         miqTarget: "ExtManagementSystem"

         severity: "ERROR"

         url: "https://www.example.com/too_many_pods_fixing_instructions"

         message: "Too many running pods"

     - alert: "Node CPU Usage"

       expr: (100 - (avg by (instance) (irate(node_cpu{app="prometheus-node-exporter",mode="idle"}[5m])) * 100)) > 3

       for: 30s

       labels:

         severity: "ERROR"

       annotations:

         miqTarget: "ExtManagementSystem"

         severity: "ERROR"

         url: "https://www.example.com/too_many_pods_fixing_instructions"

         message: "{{$labels.instance}}: CPU usage is above 4% (current value is: {{ $value }})"
This will create an alert on running pods count, CPU usage, and if the node is down. We can check the same data in the Prometheus web UI:(100 - (avg by (instance) (irate(node_cpu{app="prometheus-node-exporter",mode="idle"}[5m])) * 100)) > 4 and sum(kubelet_running_pod_count)
Now we will configure our mail client for the alert manager. Edit configMap oc edit cm prometheus-alerts and modify it to look like this:
apiVersion: v1

data:

 alertmanager.yml: |

   global:

     smtp_smarthost: 'in-v3.mailjet.com:25'

     smtp_from: 'xxxx@gmail.com'

     smtp_auth_username: 'xxxxx'

     smtp_auth_password: 'xxxxx'

   # The root route on which each incoming alert enters.

   route:

     # default route if none match

     receiver: all

     # The labels by which incoming alerts are grouped together. For example,

     # multiple alerts coming in for cluster=A and alertname=LatencyHigh would

     # be batched into a single group.

     # TODO:

     group_by: []

     # All the above attributes are inherited by all child routes and can

     # overwritten on each.

   receivers:

   - name: alert-buffer-wh

     webhook_configs:

     - url: http://localhost:9099/topics/alerts

   - name: mail

     email_configs:

     - to: "info@containers.ninja"

   - name: all

     email_configs:

     - to: "info@containers.ninja"

     webhook_configs:

     - url: http://localhost:9099/topics/alerts

kind: ConfigMap

metadata:

 creationTimestamp: null

 name: prometheus-alerts
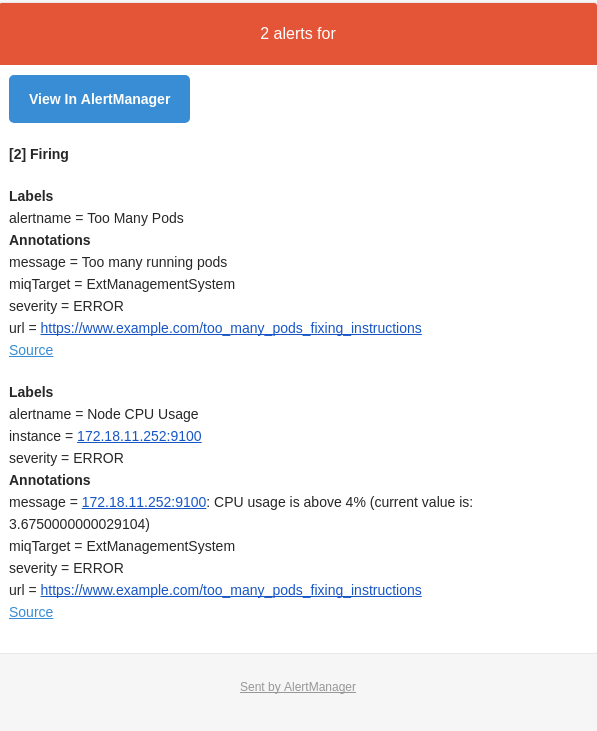
This will send alert to both backends so they will be available via API of the alert-buffer and mail. The alert buffer API https://alerts-openshift-metrics.apps.34.229.160.53.xip.io/topics/alerts shows alerts being triggered:

And after few seconds emails start coming through:
It is an early stage for Prometheus in OpenShift. But even with the current configuration, the value it brings to the platform is huge. Having real-time monitoring with close to real-time alerts is the key to the success when operating a distributed system. If you aren't convinced yet of the importance of real-time alerting, more arguments can be found in the Alerting from Time-Series Data blog post from our friends at Google.
저자 소개
유사한 검색 결과
강력한 보안, 즉시 사용 가능, 추가 비용 없이 제공: 컨테이너 보안의 진화
Red Hat Universal Base Image (다시) 소개
The Containers_Derby | Command Line Heroes
Can Kubernetes Help People Find Love? | Compiler
채널별 검색

오토메이션
기술, 팀, 인프라를 위한 IT 자동화 최신 동향

인공지능
고객이 어디서나 AI 워크로드를 실행할 수 있도록 지원하는 플랫폼 업데이트

오픈 하이브리드 클라우드
하이브리드 클라우드로 더욱 유연한 미래를 구축하는 방법을 알아보세요

보안
환경과 기술 전반에 걸쳐 리스크를 감소하는 방법에 대한 최신 정보

엣지 컴퓨팅
엣지에서의 운영을 단순화하는 플랫폼 업데이트

인프라
세계적으로 인정받은 기업용 Linux 플랫폼에 대한 최신 정보

애플리케이션
복잡한 애플리케이션에 대한 솔루션 더 보기
가상화
온프레미스와 클라우드 환경에서 워크로드를 유연하게 운영하기 위한 엔터프라이즈 가상화의 미래