A common challenge is serving machine learning models to multiple different locations, whether that be public cloud, on premise or the edge. This problem is amplified when using common cloud service AI platforms and wishing to serve models to the edge. Users of OpenShift benefit because of the true hybrid nature of the platforms it supports, and with a product like Red Hat OpenShift Data Science, the effort to service these models becomes seamless. Now let's see how this can be done.
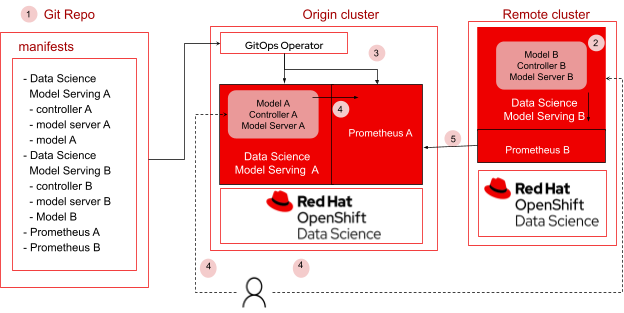
Figure 1. Serving and monitoring models across clusters
In this blog, we will explore how to serve models across clusters and use Prometheus to gather performance metrics from the deployed models. Using GitOps, a cloud native way for continuous deployment, users will be able to easily automate the configuration of necessary packages, cross-cluster deployment and monitoring of machine learning models. In this example, we will be using two clusters, the origin cluster and the remote cluster. Both clusters will have their own instances of models deployed, and monitoring using Prometheus. We will be using Prometheus federation to scrape metrics collected in the remote cluster and enable users to view the metrics in the dashboard within the origin cluster. This allows users to have a single view of the metrics for all models deployed across different clusters. Figure 1 shows the flow of steps from setting up the git repository to deploying and monitoring the models.
1. All artifacts required to install Data science model serving A and B, models A and B, and Prometheus are available in the git repository
2. Red Hat OpenShift Data Science (RHODS), which includes the model serving components, is required to be installed on all clusters. Additionally install Red Hat OpenShift GitOps on the origin OpenShift cluster and Prometheus on all clusters.
3. Using GitOps operator
a. Users deploy models to remote and origin clusters.
b. Users configure Prometheus on remote clusters to collect performance metrics from model servers running on each of those clusters. Users configure Prometheus with federation on origin cluster to be sure that model metrics from all remote clusters are collected into the origin cluster.
4. User performs inference on endpoints for models A and B.
5. Users are able to view information on metrics (from all clusters) in the origin cluster.
Deployment Steps (Using GitOps)
Create two OpenShift clusters. In this example, we use the following clusters:
Origin Cluster: https://console-openshift-console.apps.ocluster.dev.datahub.redhat.com
Remote Cluster: https://console-openshift-console.apps.rcluster.dev.datahub.redhat.com/
Considerations
1. RHODS, including the model serving component, is required to be installed in the origin and remote clusters.
2. Additional packages installed via Operator are:
a. Prometheus 0.56.3
b. Red Hat OpenShift GitOps
3. All required files to deploy the models and configure prometheus are provided in the git repository https://github.com/rh-aiservices-bu/cross-cluster-serving
4. Model locations and prometheus endpoints are handled in a secure way using sealed secrets (via kubeseal). The secrets have been encrypted and then committed to the above git repository. Users are not restricted to using sealed secrets or kubeseal. Please free to use your own choice of encryption for any resource that needs to be secured.
Setup Clusters with Required Packages
Step 1: Install RHODS with Data Science Model Serving
1. git clone https://gitlab.cee.redhat.com/data-hub/olminstall
2. cd olminstall
3. ./setup.sh quay.io/cfchase/rhods-operator-live-catalog:1.20.0-cchase-dev
Step 2: Install Prometheus
1. Install Prometheus 0.56.3 via OperatorHub on all clusters
2. Configuring Prometheus will be done via Red Hat OpenShift GitOps.
Step 3: Install Red Hat OpenShift GitOps
1. Install Red Hat OpenShift GitOps via OperatorHub on Origin Cluster
2. Create an instance of ArgoCD in the preferred namespace (example: argocd).
3. Click on the route to argoCD instance under Networking -> Routes. You would need the login credentials which can be obtained under Secrets -> argocd-cluster
4. Install argocd cli from here.
5. To add the clusters to argoCD, follow these steps.
a. argocd login <link-to-argocd-instance>
b. argocd cluster add
c. argocd cluster add <select-origin-cluster-name-from-step-b>
d. argocd cluster add <select-remote-cluster-name-from-step-b>
6. Access the argocd UI by clicking on the route to argoCD instance under Networking ->
Routes. You would need the login credentials which can be obtained under Secrets ->
argocd-cluster.
Model Serving and Monitoring on Remote Clusters
Step 1: Sealed Secrets to encrypt Model Location
Install Kubeseal
1. VERSION=$(curl --silent "https://api.github.com/repos/bitnami-labs/sealed-secrets/releases/latest" | grep '"tag_name"' | sed -E 's/.*"([^"]+)".*/\1/')
2. wget https://github.com/bitnami-labs/sealed-secrets/releases/download/$VERSI… -O /usr/local/bin/kubeseal
3. chmod 755 /usr/local/bin/kubeseal
4. kubeseal --version
Install Cluster side controller
1. kubectl apply -f https://github.com/bitnami-labs/sealed-secrets/releases/download/$VERSION/controller.yaml
2. oc login <remote-cluster>
3. kubeseal --format yaml <secret.yaml > sealedsecret.yaml
Note: secret.yaml contains the secret in the YAML format with the data base64 encoded. This can be created and obtained from the cluster or created using oc cli (sample yaml below). Users need to do this only once per cluster so that the cluster is aware of the key to decrypt any subsequent encryptions.
apiVersion: v1
kind: Secret
metadata:
  name: storage-config
stringData:
  s3storage: |
    {
      "type": "s3",
      "access_key_id": " XXXXXX",
      "secret_access_key": "XXXX",
      "endpoint_url": "https://s3.amazonaws.com/",
      "default_bucket": "models-kserve",
      "region": "us-east-1"
    }
4. Commit the sealedsecret.yaml to the repo manifests/models/remote_cluster
Step 2: Model Serving on Remote Cluster
a. Deploy Model to Remote Cluster
To deploy the model, create an argo application using the following parameters
CLUSTER <select the remote cluster name from the dropdown list>
NAMESPACE my-project
REPO URL https://github.com/rh-aiservices-bu/cross-cluster-serving
PATH manifests/models/remote_cluster/
SYNC OPTIONS Create Namespace
Create the application and click on Sync (if automatic sync preferred, please select the option while creating the application)
b. Test Model Deployment
Set ROUTE and TOKEN as follows
ROUTE=$(oc get routes -n my-project my-model --template={{.spec.host}}{{.spec.path}})
TOKEN=$(oc sa new-token user-one -n my-project)
Perform prediction on sample data as follows
curl -k https://$ROUTE/infer -d '{"inputs": [{ "name": "dense_input", "shape": [1, 7], "datatype": "FP64", "data": [[0.36, 0.20, 9.79, 0.009, -0.13, -0.02, 0.14]]}]}' -H "Authorization: Bearer $TOKEN”
You should see output like below
{"model_name":"my-model__isvc-6102be7f79","model_version":"1","outputs":[{"name":"dense_3","datatype":"FP32","shape":[1,1],"data":[1]}]}
Step 3: Model Monitoring on Remote Cluster
To deploy the monitoring configurations, create an argo application as above but using the following value for PATH
PATH manifests/monitoring/remote_cluster/
Click on Routes to view the route to the prometheus dashboard. Click on the link to view the dashboard for monitoring the model. Use the sample query to view metrics related to the triton model server
{pod="modelmesh-serving-triton-2.x-5b4d448855-97s84"}
Model Serving and Monitoring on Origin Cluster
Step 1: Sealed Secrets to encrypt Model Location
a. Install the cluster side controller and create sealedsecret.yaml
b. Create prometheus-additional.yaml as follows
- job_name: "prometheus"
  static_configs:
  - targets: ["route to prometheus monitoring on remote cluster"]
example:
  - targets: ["rhods-model-monitoring-monitoring.x.x.x.com"]
c. Create additional-scrape-configs.yaml as follows
oc create secret generic additional-scrape-configs
 --from-file=prometheus-additional.yaml -oyaml > additional-scrape-configs.yaml
d. kubeseal --format yaml <additional-scrape-configs.yaml > sealedsecret-prometheus.yaml
e. Commit the sealedsecret-prometheus.yaml to cross-cluster-serving/tree/main/manifests/monitoring/origin_cluster
Step 2: Model serving and monitoring on Origin Cluster
a. Create Argo applications for serving the model and monitoring configurations as done for the remote cluster.
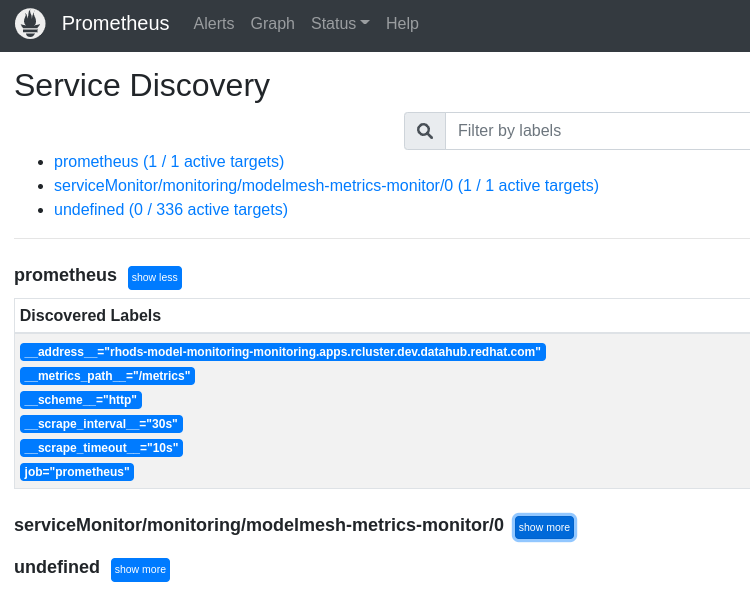
b. Click on routes to view the Prometheus dashboard as we did for remote cluster. Now you should be able to see the metrics from remote cluster in the dashboard of the origin cluster as below
Summary
In this blog, we showed how users can combine Red Hat OpenShift Data Science, Prometheus and GitOps to effortlessly configure packages, deploy and monitor machine learning models across different locations. We also showed one way of how users can protect sensitive data within the configurations or other artifacts using sealed secrets. We highly encourage users to try out the new features in Red Hat OpenShift Data Science. For more information, please visit the Red Hat OpenShift Data Science portal here.
저자 소개

유사한 검색 결과
과거의 운영 방식에서 벗어나 IT의 미래 구축
추론에서 에이전트까지: Red Hat AI 3.4를 통해 기업의 AI 확장
Technically Speaking | Build a production-ready AI toolbox
Technically Speaking | Platform engineering for AI agents
채널별 검색

오토메이션
기술, 팀, 인프라를 위한 IT 자동화 최신 동향

인공지능
고객이 어디서나 AI 워크로드를 실행할 수 있도록 지원하는 플랫폼 업데이트

오픈 하이브리드 클라우드
하이브리드 클라우드로 더욱 유연한 미래를 구축하는 방법을 알아보세요

보안
환경과 기술 전반에 걸쳐 리스크를 감소하는 방법에 대한 최신 정보

엣지 컴퓨팅
엣지에서의 운영을 단순화하는 플랫폼 업데이트

인프라
세계적으로 인정받은 기업용 Linux 플랫폼에 대한 최신 정보

애플리케이션
복잡한 애플리케이션에 대한 솔루션 더 보기
가상화
온프레미스와 클라우드 환경에서 워크로드를 유연하게 운영하기 위한 엔터프라이즈 가상화의 미래