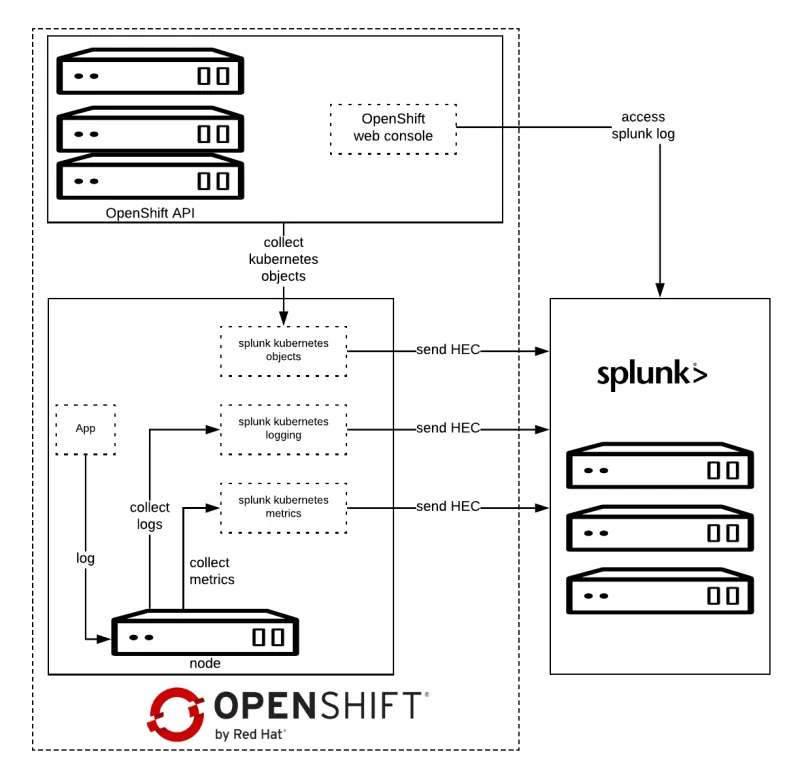
Red Hat OpenShift already provides an aggregated logging solution based on the EFK stack, fully integrated with the platform. But we also provide choice for companies that have settled on a different platform.
Some companies have a Splunk logging platform to store and to aggregate the logs for all their environments and they want to send their container logs to the same platform.
This post explains how to easily integrate Splunk with Red Hat OpenShift using the new Splunk Connect for Kubernetes. The first part is focused on how to use Splunk Kubernetes Logging.
Prerequisites
- Splunk Enterprise 7.0 or later
- An HEC token used by the HTTP Event Collector to authenticate the event data.
- Have a minimum of two Splunk indexes ready to collect the log data, one for both logs and Kubernetes objects, and one for metrics. You can also create separate indexes for logs and objects, in which case you will need three Splunk indexes.
- Helm
More information here: Splunk Connect Prerequistes
Architecture
Splunk Connect for Kubernetes deploys:

- One DaemonSet on each OpenShift node for collecting log.
- One DaemonSet on each OpenShift node for collecting metrics.
- One Deployment to collect OpenShift Objects changes.
Configure Splunk Connect project
Create Project
First of all, create the target project.
oc adm new-project splunk-connect --node-selector=""

oc project splunk-connect
The node-selector is necessary to allow the daemonset to run in all the nodes.
Configure HELM
Create tiller Service Account and relative role admin. Tiller must be able to edit the project.
oc create sa tiller

oc adm policy add-role-to-user admin -z tiller
Deploy tiller.
helm init --override 'spec.template.spec.containers[0].command'='{/tiller,--storage=secret,--listen=localhost:44134}' \

--service-account=tiller \

--tiller-namespace=splunk-connect
Information about securing HELM:
Note: We're using Helm here because it's what's supported by Splunk Connect. However, our supported way to define and install applications is using OpenShift Templates and Ansible.
Installation
Download the latest Helm Splunk Kubernetes Logging Helm package, which at the time of writing is 1.1.0.
wget <a href="https://github.com/splunk/splunk-connect-for-kubernetes/releases/download/1.1.0/splunk-kubernetes-logging-1.1.0.tgz">https://github.com/splunk/splunk-connect-for-kubernetes/releases/download/1.1.0/splunk-kubernetes-logging-1.1.0.tgz</a>
Configure the variables for Helm, you can find sample values on GitHub:
Minimal value example:
global:
  splunk:
    hec:
      host: splunk.openlab.red
      port: 8080
      token: xxxxxx-xxxx-xxxx-xxx-xxxxxxxxx
      protocol: https
Splunk Kubernetes Logging
Splunk Kubernetes Logging uses the Kubernetes node logging agent to collect logs. Splunk deploys a daemonset on each of these nodes. Each daemonset holds a Fluentd container to collect the data.
Setup
- Create service account for logging.
oc create sa splunk-kubernetes-logging
2. Assign privileged permission.
oc adm policy add-scc-to-user privileged -z splunk-kubernetes-logging
Logging pods need access to /var/log/*
3. Install Helm package
helm install --tiller-namespace=splunk-connect --name splunk-kubernetes-logging -f logging-value.yml splunk-kubernetes-logging-1.1.0.tgz
4. The following patch adds privileged=true securityContext and service account splunk-kubernetes-logging.
oc patch ds splunk-kubernetes-logging -p '{5. Delete the pods to apply the latest patch.
"spec":{
"template":{
"spec":{
"serviceAccountName": "splunk-kubernetes-logging",
"containers":[
{
"name":"splunk-fluentd-k8s-logs",
"securityContext":{
"privileged":true
}
}
]
}
}
}
}'
oc delete pods -lapp=splunk-kubernetes-logging
Verify on Splunk

Splunk OpenShift Web Console Extension
The OpenShift Web Console provides a way to customize its layout, and with this extension we are able to easily access the Splunk log for a specific container from OpenShift Web Console.
Setup
- Deploy the OpenShift web console extension
oc project openshift-web-console
oc new-app https://github.com/openlab-red/ext-openshift-web-console --name=ext -lapp=ext --context-dir=/app
oc patch dc ext -p '{
                 "spec": {
                     "template": {
                         "spec": {
                             "nodeSelector": {
                                 "node-role.kubernetes.io/master": "true"
                             }
                         }
                     }
                 }
             }'
oc scale --replicas=3 dc/ext
oc create route edge --service=ext
2. Update the extensions section of the webconsole-config configmap based on your settings.
    extensions:
      properties:
        splunkURL: "https://splunk.openlab.red"
        splunkQueryPrefix: "/app/search/search?q=search%20"
        splunkApplicationIndex: 'ocp_logging'
        splunkSystemIndex: 'ocp_system'
        splunkSystemNamespacePattern: '^(openshift|kube|splunk|istio|default)\-?.*'
| Properties | Description | Optional |
| splunkURL | Splunk Web Console Endpoint | N |
| splunkQueryPrefix | Search Context Path | N |
| splunkApplicationIndex | Index for application log | N |
| splunkSystemIndex | Index For infrastructure log | Y |
| splunkSystemNamespacePattern | Identify which namespace contains infrastructure log | Y |
3. Rollout the openshift-web-console deployment.
oc delete pod -lapp=openshift-web-console
4. Splunk Extension outcome.

Conclusion
In this article we have explored how we can forward applications log to Splunk.
In the next post will see how to collect OpenShift/Kubernetes metrics and Kubernetes objects to Splunk.
