Organizations are increasingly being tasked with managing billions of files and tens to hundreds of petabytes of data. Object storage is well suited to these challenges, both in the public cloud and on-premise. Organizations need to understand how to best configure and deploy software, hardware, and network components to serve a diverse range of data intensive workloads.
This blog series details how to build robust object storage infrastructure using a combination of Red Hat Ceph Storage coupled with Dell EMC storage servers and networking. Both large-object and small-object synthetic workloads were applied to the test system and the results subjected to performance analysis. Testing also evaluated the ability of the system under test to scale beyond a billion objects.
Test Lab Environment
Testing was performed in a Dell EMC lab using their hardware, and hardware contributed by Intel.
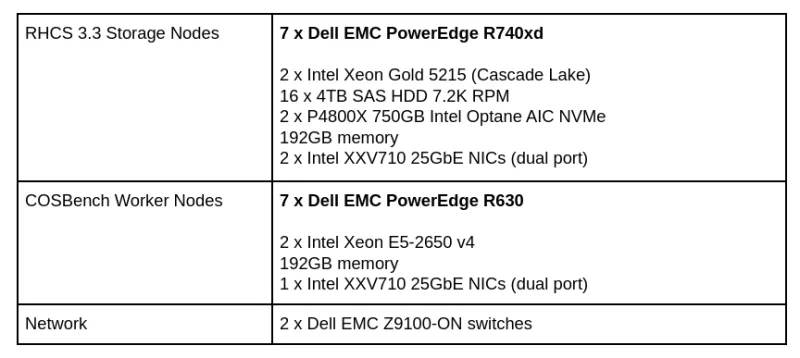
Hardware Configuration

Table 1: Hardware configurations

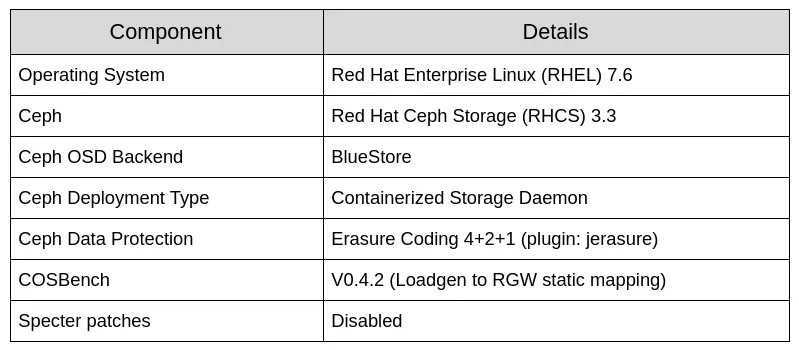
Table 2: Software configurations

Table 3: Resource limitation
Lab Rack Design

Figure 1: Lab Rack Design
RHCS Logical Architecture

Figure 2: Test Lab logical design
Test Methodology: Finding answers to foundational questions
Before the Red Hat Storage Solution Architectures Team begins a new project, we formulate a handful of foundational questions that we intend to answer during the course of the project, which is generally a few months. We shortlist and prioritize questions after discussing with various stakeholders who are well versed with Red Hat Ceph Storage; large customers, our technical sellers, product management, engineering, and support. As such, the following is the carefully curated list of questions that we will be providing answers to with this Object Storage Performance and Sizing series.
-
What is the optimal CPU/Thread allocation ratio per RGW instance?
-
What is the recommended Rados Gateway (RGW) deployment strategy?
-
What is the maximum performance on a fixed-sized cluster?
-
How is cluster performance and stability influenced as the cluster population approaches 1 Billion objects?
-
How does bucket sharding lend to increased bucket scalability, and what are the performance implications?
-
How does the new Beast frontend for RGW compare to Civetweb?
-
What’s the performance delta between RHCS 2.0 FileStore and RHCS 3.3 BlueStore?
-
Performance effects of EC Fast_Read vs Regular Reads?
Payload Selection
Object storage payloads vary widely, and payload size is a crucial consideration in designing benchmarking test cases. In an ideal benchmarking test case, the payload size should be representative of a real-world application workload. Unlike testing for block-storage workloads that typically read or write only a few kilobytes, testing for object storage workloads needs to cover a wide spectrum of payload sizes. For Red Hat testing, the following object payload sizes were selected:

Data processing applications tend to operate on larger sized files, based on our testing we found that 32MB is the largest object size that COSBench can handle reliably at the scale of our testing.
Executive Summary
Red Hat Ceph Storage is able to run on myriad industry-standard hardware configurations. This flexibility can be intimidating to those who are not familiar with the most recent advances in both system hardware, and in Ceph software components. Designing and optimizing a Ceph cluster requires careful analysis of the applications, their required capacity, and workload profile. Red Hat Ceph Storage clusters are often used in multi-tenant environments, subjected to a diverse mix of workloads. Red Hat, Dell EMC, and Intel carefully selected system components that we believed would have a profound effect on performance. Tests evaluated workloads in three broad categories:
-
Large-object workloads (throughput)
Red Hat testing showed near-linear scalability for both read and write throughput with the addition of Rados Gateway (RGW) instances until it peaked due to OSD node disk contention. As such we measured over 6GB/s aggregated bandwidth for both read and write workloads.
-
Small-object workloads (operations per second)
Small-object workloads are more heavily impacted by metadata I/O than are large-object workloads. The client write operations scaled sub-linearly and topped at 6.3K OPS with 8.8 ms average response time until saturated by OSD node disk contention. Client read operations topped at 3.9K OPS which could be attributed to lack of Linux page cache within the BlueStore OSD backend.
-
Higher object-count workloads (Billion objects or more)
As the object population in a bucket grows, there is a corresponding growth in the amount of index metadata that needs to be managed. Index metadata is spread across a number of shards to ensure it can be accessed efficiently. When the number of objects in a bucket is larger than what can be efficiently managed with the current number of shards, Red Hat Ceph Storage will dynamically increase the number of shards. Over the course of our testing we found that dynamic sharding events have a detrimental, but temporary impact on the throughput of requests destined to a bucket that is dynamically sharding. If a developer has a priori knowledge that a bucket will grow to a given population, that bucket can be created with or manually updated to a number of shards that will be able to efficiently accommodate the amount of metadata. Our testing revealed that buckets that have been pre-shared deliver more deterministic performance, because they do not need to reorganize bucket index metadata as object count increases.
During both large and small object size workload tests, Red Hat Ceph Storage delivered significant performance improvements relative to previous performance and sizing analysis. We believe these improvements can be attributed to the combination of the BlueStore OSD backend, the new Beast web frontend for RGW, the use of Intel Optane SSDs for BlueStore WAL and block.db, and the latest generation processing power as provided by Intel Cascade Lake processors.
Architectural Summary

Table 5: Architectural Summary
Ceph Baseline Performance Test
To record native Ceph cluster performance, we used the Ceph Benchmarking Tool
(CBT), an open-source tool for automation of Ceph cluster benchmarks. The goal was to find the cluster aggregate throughput high-water mark. This watermark is the point beyond which throughput either remains flat, or decreases.
The Ceph cluster was deployed using Ceph-Ansible playbooks. Ceph-Ansible creates a Ceph cluster with default settings. As such, baseline testing was done with a default Ceph configuration with no special tuning applied. Using CBT, seven iterations of each benchmark scenario were run. The first iteration executed the benchmark from a single client, the second from two clients, the third from three clients in parallel, and so on.
The following CBT configuration was used:
-
Workload: Sequential write tests followed by sequential read tests
-
Block Size: 4MB
-
Runtime: 300 seconds
-
Concurrent threads per client: 128
-
RADOS bench instance per client: 1
-
Pool data protection: EC 4+2 jerasure OR 3x Replication
-
Total number of clients: 7
As shown in chart 1 and chart 2, performance scaled sub-linearly for both write and read workloads as the number of clients increased. Interestingly, the configuration using an erasure coding data protection scheme delivered a near symmetrical 8.4GBps for both write and read throughput. This symmetry had not been observed in previous studies, and we believe that it can be attributed to the combination of BlueStore and Intel Optane SSDs. We could not identify any system level resource saturation during any of the RADOS bench tests. Had additional client nodes been available to further stress the existing cluster, we might have observed even higher performance and potentially been able to saturate the underlying storage media.

Chart 1: Radosbench 100% write test

Chart 2: Radosbench 100% read test
Summary & Up Next
In this post, we detailed the lab architecture, including hardware and software configurations, shared some results from low level cluster benchmarks, and provided a high-level executive and architectural summary. In the next post, we’re looking forward to covering Ceph RGW deployment strategies and to provide RGW resource allocation guidelines.
Sobre el autor
Más como éste
Friday Five — February 13, 2026 | Red Hat
PNC’s infrastructure modernization journey with Red Hat OpenShift Virtualization
Data Security And AI | Compiler
Data Security 101 | Compiler
Navegar por canal
Automatización
Las últimas novedades en la automatización de la TI para los equipos, la tecnología y los entornos
Inteligencia artificial
Descubra las actualizaciones en las plataformas que permiten a los clientes ejecutar cargas de trabajo de inteligecia artificial en cualquier lugar
Nube híbrida abierta
Vea como construimos un futuro flexible con la nube híbrida
Seguridad
Vea las últimas novedades sobre cómo reducimos los riesgos en entornos y tecnologías
Edge computing
Conozca las actualizaciones en las plataformas que simplifican las operaciones en el edge
Infraestructura
Vea las últimas novedades sobre la plataforma Linux empresarial líder en el mundo
Aplicaciones
Conozca nuestras soluciones para abordar los desafíos más complejos de las aplicaciones
Virtualización
El futuro de la virtualización empresarial para tus cargas de trabajo locales o en la nube
