Logs are a powerful tool for developers to debug their applications and operators to understand their application’s state. Unfortunately, they also add complexity to the software stack. They require hierarchically ranked logs, deployment of additional software to collect the data, and sufficiently large amounts of storage to keep it. Despite the overhead, teams still make the effort to ensure that they have a robust and stable logging system for their applications. This need has produced a plethora of logging solutions, including this article’s subject: Grafana Loki.
Grafana Loki — or Loki — is an open-source, log aggregation tool developed by Grafana Labs. It is designed to be optimized for log ingestion and storage and is highly configurable. There are a number of ways to install Loki into an environment, such as the Loki Operator. This application can deploy and manage a Loki installation on a Kubernetes or OpenShift cluster through an opinionated API. This interface allows a human operator to make various changes without needing to interact with Loki’s more complicated configurations.
Part of the abstraction provided by the Loki Operator’s API is the sizing of the installation. This is through the concept of a shirt size. The operator provides two production ready sizes: 1x.small and 1x.medium. The major differences (full details here) between them is the increase in the replication factor and the replica count and resources for the ingester and querier components. This allows the 1x.medium to provide more resiliency than the 1x.small in production environments.
While this feature allows for an expedient way to create a Loki cluster, it does have its drawbacks. One of these limitations is that the operator does not allow for the explicit setting of resources for the components. This means that there is no vertical scaling, resizing, or setting of resource limits for the component(s) through the API. However, there is a way of applying a soft resource limit on the pods through Loki’s rate limiting feature, which is configurable through the operator’s API.
Despite this, this article will still attempt to benchmark and discover the “limits” of the production shirt sizes offered by the Loki Operator.
Testing Stack
The following tests were done using the mentioned resources:
- OpenShift v4.11.3
- m4.16xlarge AWS cluster (three worker and master nodes)
- Loki Operator (OpenShift Logging 5.6.z) with Loki v2.7.1
For the test bench, Loki Benchmarks was used. This tool can execute the benchmarks with three different methods of deploying Loki onto a Kubernetes or OpenShift cluster. It uses Prometheus to query the metrics and Ginkgo to run the suite and compile the results. For this report, the Loki Operator deployment style and the default OpenShift Prometheus installation were used.
Note: These tests were run with a version of the Loki Operator that contained a bug, which caused the an incorrect number of Lokistack Gateway components to be deployed. This is not thought to have any negative impact on the results and has been fixed in current releases of the operator.
Ingestion Path
These tests summarize the network and resource usage of the following Loki components: distributor and ingester.
Tests (Duration: 30m, Polling Interval: 3m):
- 500 GBpd (~6 MBps) (6 streams)
- 1 TBpd (~12 MBps) (12 streams)
- 2 TBpd (~24 MBps) (24 streams)
- 4 TBpd (~48 MBps) (48 streams)
In order to stress the system, several Promtail applications were deployed to generate and send logs to Loki through the Lokistack Gateway. The Gateway is an additional component used by the Loki Operator to ensure secure access to the installation. The Promtail applications were given the appropriate TLS certificates and tokens in order to properly communicate with this component. Combined, the rate of sent logs is approximately the values described above for each test.
Results
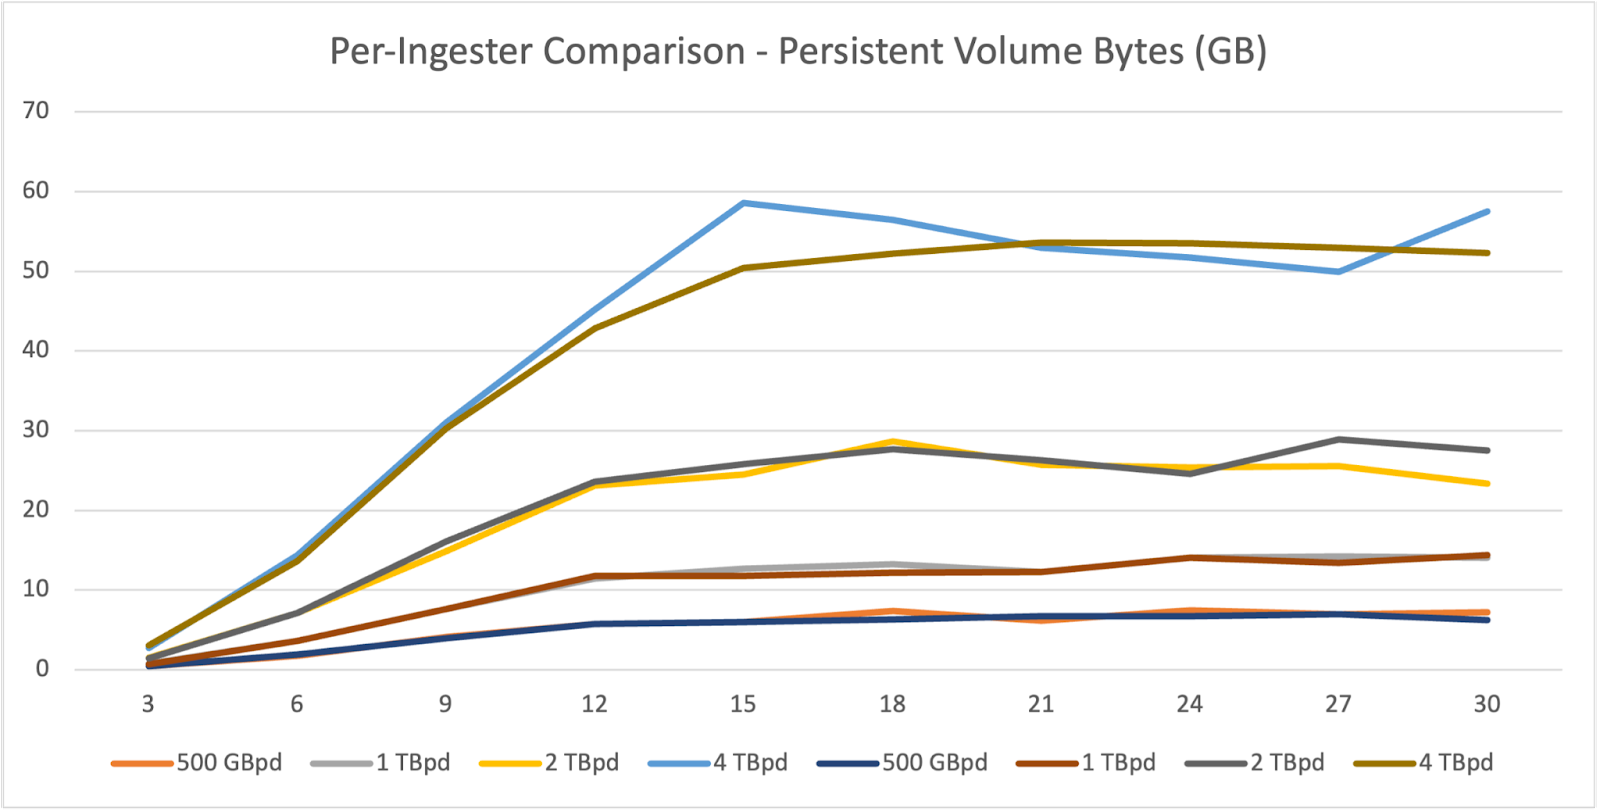
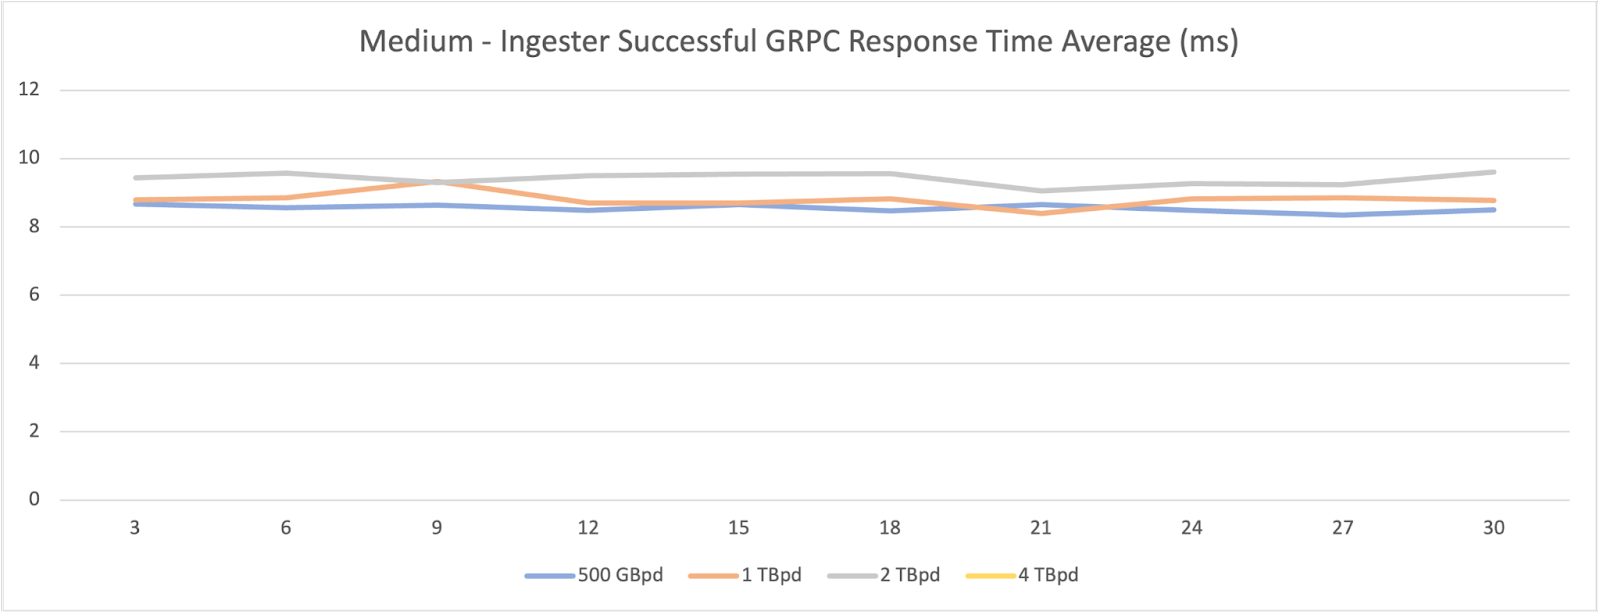
The values reported are the average over the time of the sample and the sum of all pods deployed. The y-axis is the measured resource (specified in the graph title) and the x-axis is the time in minutes. Log rates are described as gigabytes per day (GBpd) or terabytes per day (TBpd).
Container CPU
Ingester
Container Working Set Memory
Ingester
Persistent Volume Bytes
Ingester
Average Response Times
Distributor
Ingester
Summary
As seen above — and almost as expected — there is a doubling effect in the resource usage for each test. This makes sense as the log generation rate is doubled. The ingester and distributor have little trouble keeping an average response time of ~10 ms and ~22 ms respectively.
Insights: Similarities between production sizes
Although the data assumes an even distribution (which is not always true), the per-ingester resource consumption is strikingly similar. This is because, by default, both 1x.small and 1x.medium maintain the same log-to-ingester ratio. The replication factor controls how many times a log is duplicated. Since the operator’s default configuration is that a copy of a log is sent to all ingesters, each one is essentially taking on the same workload. That is to say that the results above show each ingester is consuming roughly the same amount of log data and memory streams.
Insights: Going Beyond 4 TBpd
As of this posting, 1x.small has a default log ingestion rate of 500 GBpd and the 1x.medium has a default log ingestion rate of 2 TBpd. The intention behind these ratings is to set the expectation of what the system can take without crashing or undergoing serious complications. When going beyond the configured rate, Loki will reject requests from the log generator. This prevents the system from consuming all the resources available to the node as there are no resource limits on the pods. To avoid this for these tests, these defaults were overwritten via the Loki Operator’s API.
Unfortunately even with “infinite” resources, when sending sufficiently large amounts of data, the Loki installation can be overwhelmed. This behavior was observed in the following scenarios:
- 8 TBpd (~96 MBps) (96 streams)
- 16 TBpd (~192 MBps) (192 streams)
- 32 TBpd (~384 MBps) (384 streams)
At these rates, the following behavior was observed:
- WAL storage was 100% filled
- distributor and ingester average response times double or triple
- 500 Context Deadline Exceeded responses are emitted from the distributor
- 500 HTTP internal server error responses are emitted from the ingester for flushing chunks
In order to tackle these higher workloads, the shirt size deployments would need to be modified beyond what is currently offered.
Critique Response: Low number of memory streams
One criticism of these tests could be that the number of memory streams (combination of log labels) tested is unrealistically low (under 100) for a production environment. While this is true, the results did not change drastically by raising the number of streams to a much higher value (3000+). This is because the actual log rate is unchanged. Thus, Loki may consume more CPU to process more labels, but the amount of memory and storage used for the logs stays consistent with the numbers shown here. In testing, the CPU had a bump of around 200–500 millicores used. However, this was not as stringently tested.
Query Path
These tests summarize the network and resource usage of the following Loki components: query-frontend, querier, and ingester.
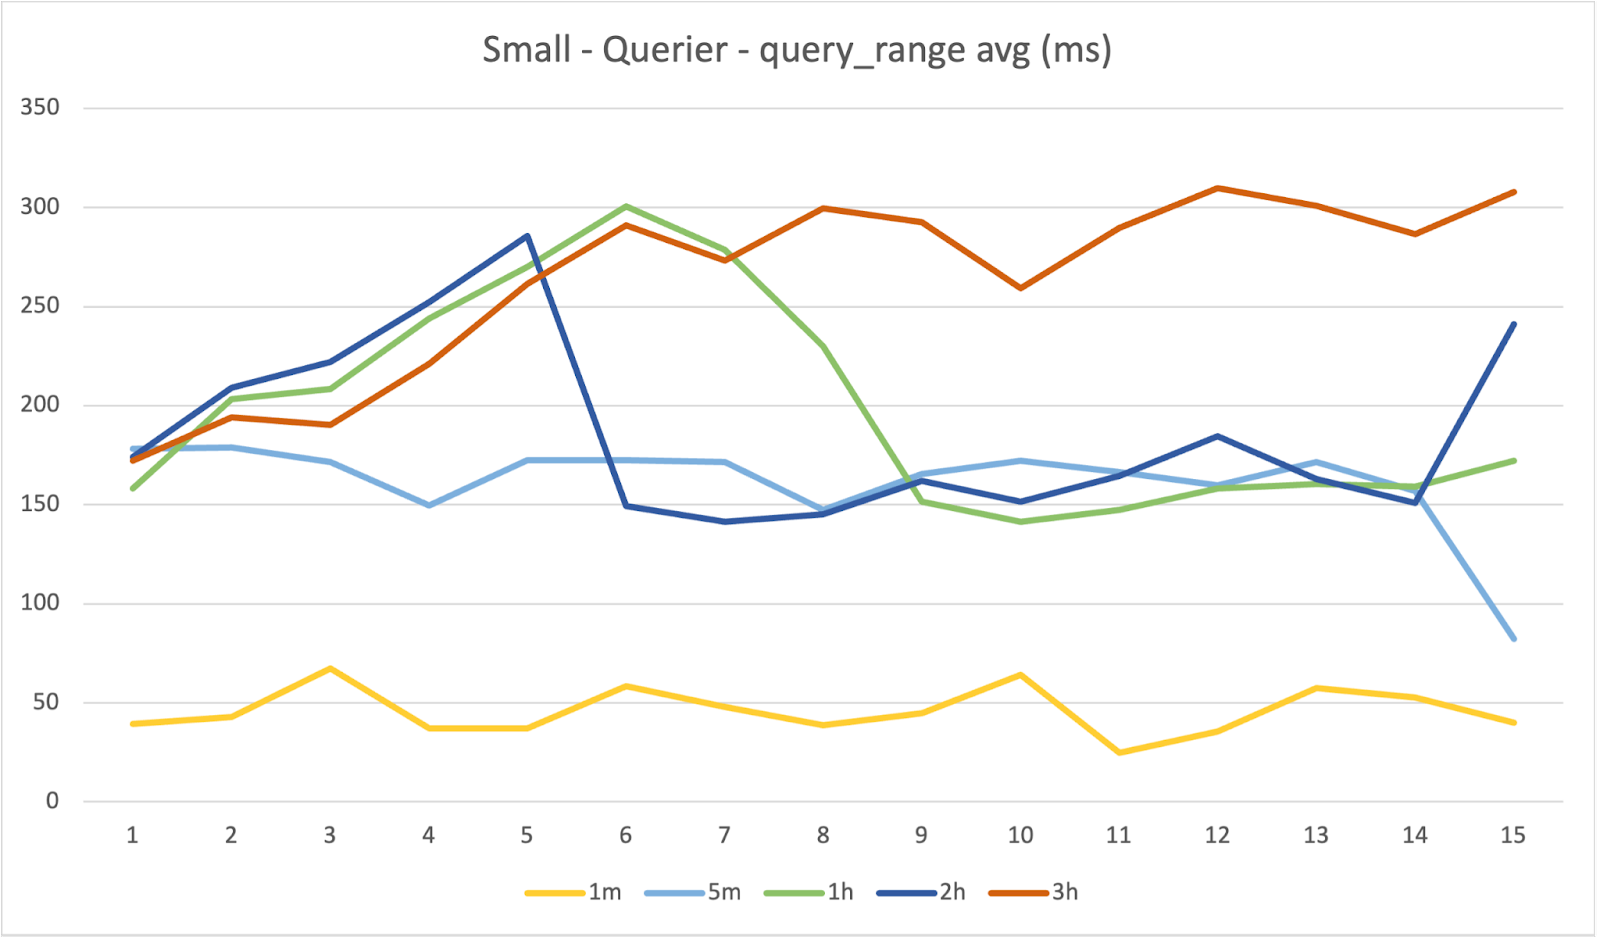
Tests (Duration: 15m, Polling Interval: 1m):
- Query Ranges: 1m, 5m, 1h, 2h, 3h
Queries Used:
- sum by (level) (rate({client=”promtail”} [1s]))
- sum(rate({client=”promtail”} |= “level=error” [1s]))
In order to stress the system, several Promtail and LogCLI applications were deployed to generate, send, and query logs to Loki through the Lokistack Gateway. The Gateway is an additional component used by the Loki Operator to ensure secure access to the installation. The Promtail and LogCLI applications were given the appropriate TLS certificates and tokens in order to properly communicate with this component.
Despite being mostly a write path component, the ingester is also part of the read process. The queriers ask the ingesters for the data they have collected (in memory and stored) when they execute a query. Thus, the ingester was also included in these tests.
Results
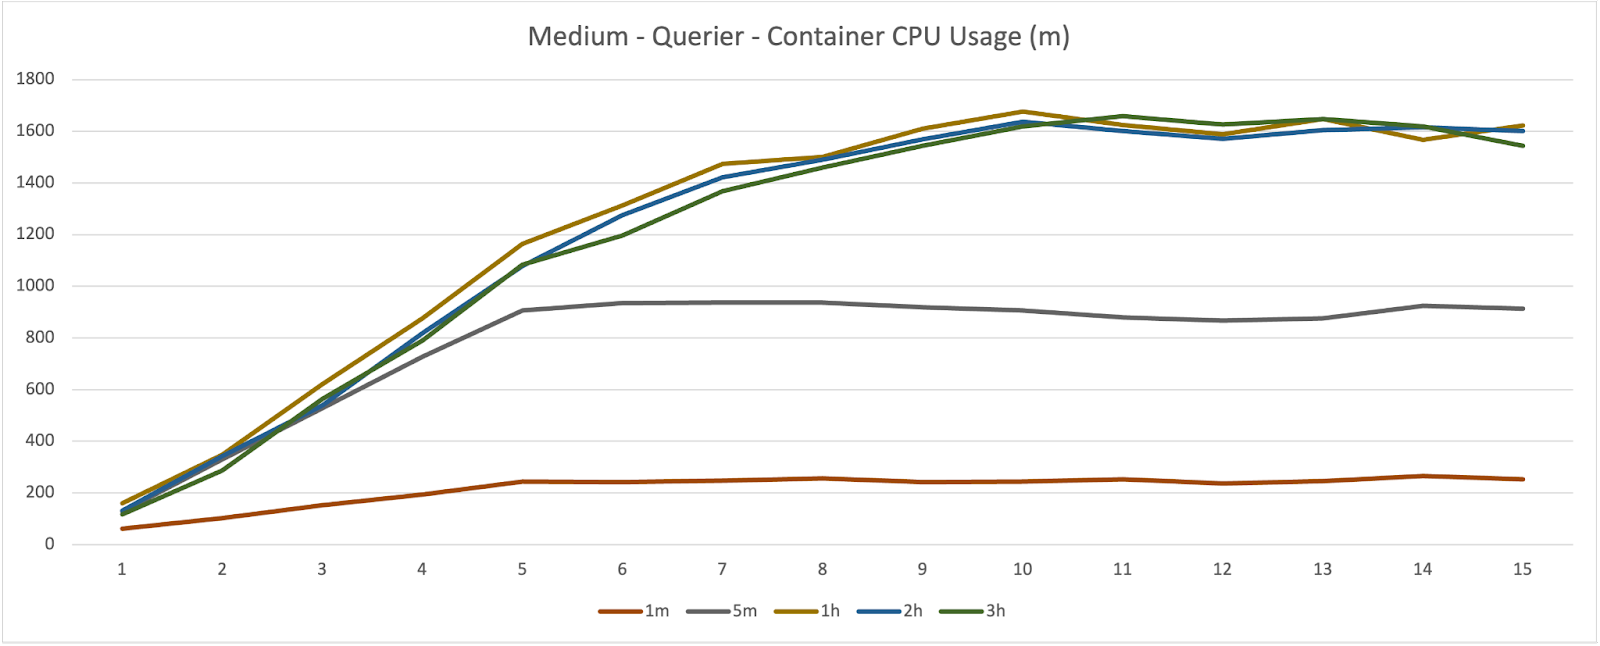
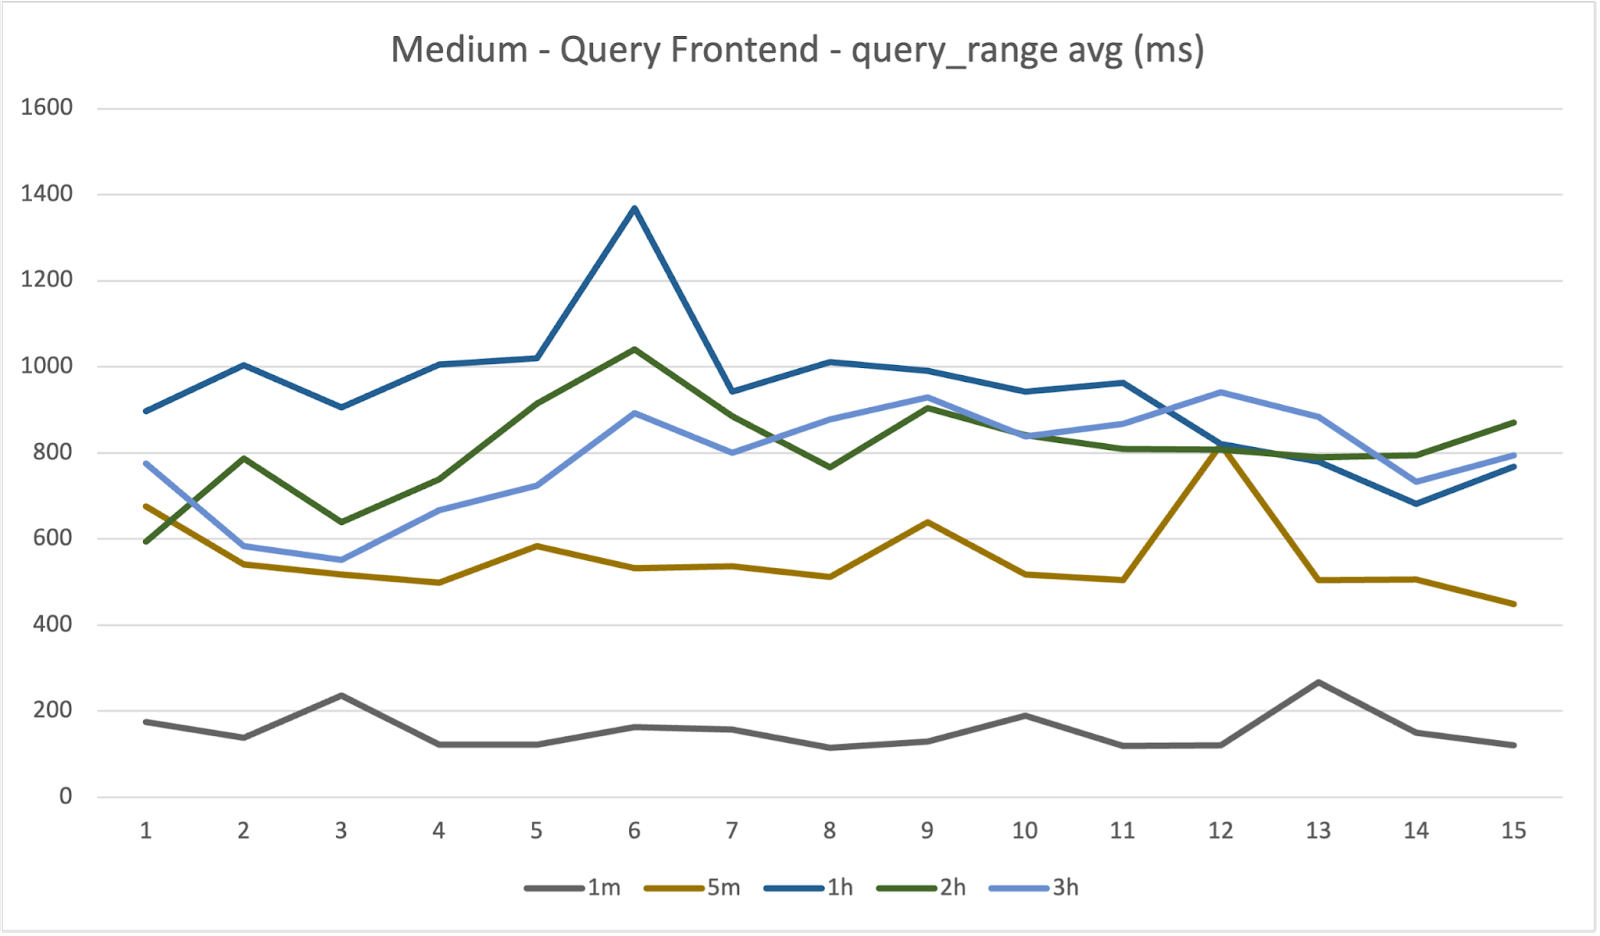
The values reported are the average over the time of the sample and the sum of all pods deployed. The y-axis is the measured resource (specified in the graph title) and the x-axis is the time in minutes.
Container CPU
Ingester
Querier
Average Response Times
Query Frontend
Querier
Summary
Unlike the write path, there are far more complications in stress testing the read path. In many ways, the results here are incomplete due to the amount of variables to test. For instance: query complexity. A complex query can mean doing many operations or a few expensive operations. Then there is also the size of the dataset. This caveat can be noted for the queries used in these tests.
There is an additional issue of a small amount of noise. For these tests, a low rate of logs were sent to the deployment throughout the test. This is because the Loki Operator — by default — has configured Loki to cache results from queries. By continuously supplying logs into the system, each LogCLI application is asking for fresh logs each time. However, this approach does result in adding a small amount of pressure to the ingester CPU. This difference can be more clearly seen in the per-ingester comparison shown in the Container CPU section. The small amount of logs available to the system may also have lead to an low memory footprint (which is why those results — working set memory — were omitted from this article).
Overall, it is difficult to make any meaningful general summations on the performance of the Loki deployments based on these results. Ideally, focusing on a more narrow domain (such as short range queries) may yield more conclusive results.
Final Thoughts
In terms of performance, there appears to be little difference between the 1x.small and 1x.medium shirt sizes provided by the Loki Operator based on the data surmised in this article. While 1x.medium provides an additional ingester and querier and gives both components more resources, the 1x.small could reasonably replicate the performance with manual customization through the API. However, certain read operations or installations needing more resiliency may require the extra room that 1x.medium provides.
À propos de l'auteur
Plus de résultats similaires
AI in telco – the catalyst for scaling digital business
Simplify Red Hat Enterprise Linux provisioning in image builder with new Red Hat Lightspeed security and management integrations
Can Kubernetes Help People Find Love? | Compiler
Scaling For Complexity With Container Adoption | Code Comments
Parcourir par canal
Automatisation
Les dernières nouveautés en matière d'automatisation informatique pour les technologies, les équipes et les environnements
Intelligence artificielle
Actualité sur les plateformes qui permettent aux clients d'exécuter des charges de travail d'IA sur tout type d'environnement
Cloud hybride ouvert
Découvrez comment créer un avenir flexible grâce au cloud hybride
Sécurité
Les dernières actualités sur la façon dont nous réduisons les risques dans tous les environnements et technologies
Edge computing
Actualité sur les plateformes qui simplifient les opérations en périphérie
Infrastructure
Les dernières nouveautés sur la plateforme Linux d'entreprise leader au monde
Applications
À l’intérieur de nos solutions aux défis d’application les plus difficiles
Virtualisation
L'avenir de la virtualisation d'entreprise pour vos charges de travail sur site ou sur le cloud


