We're happy to announce our official integration with Red Hat Openshift. This new integration brings the container monitoring goodness of Sysdig to Openshift users via an easy setup. As we launch this, we already have multiple, large organizations leveraging a combination of OpenShift and Sysdig to deploy and monitor their internal Platforms-as-a-Service operations.
As a result of the integration we are also now part of the Openshift primed partner program. We’re very excited about this, as it’s the start of a tight relationship between Sysdig and the Openshift community.
In the rest of this post, I’d like to give you an overview of why this integration is necessary, technically how we achieve visibility into your containers and microservices, and a concrete example. Let’s dig in!
The why : containers, visibility, and platforms
Containers are seeing rapid adoption due to the simplicity and consistency by which developers can get their code from a laptop to production. They are also a building blog to microservices. Many enterprises are looking to harness this new development model by creating an internal platform as a service (PaaS) that helps get containers into production more easily, whether that means a public cloud, private cloud, or even a hybrid of both. Openshift is a powerful system upon which to create this container application platform.
But containers in general have a major stumbling block as a production grade technology : visibility and monitoring are technologically harder to implement for containerized applications than legacy virtual or physical environments.
The business implications of this are intense: customers expect applications to have near-perfect uptime, high performance, and a bug-free experience. But how can you achieve that without seeing how your services are performing in production?
While containers are fantastic for developer agility and portability, they achieve that by increasing the complexity of operations.
Containers achieve portability in part by black boxing the code inside them. That layer of abstraction is great for development, but not so great for operations. And at the same time, the prospect of putting a monitoring agent in each container is both expensive in resources, and creates dependencies that could limit the value of containers.
If enterprises are truly going to build platforms leveraging containers and Openshift, then there has to be top notch monitoring of not only the hosts and containers but also the applications running inside them, and the microservices they make up. And it all has to happen in a way that respects containers’ operating principles. Enter Sysdig.
The what and the how: integrating OpenShift with Sysdig Cloud
Sysdig’s claim to fame is ContainerVision, our ability to monitor the code running inside your containers without instrumenting each individual container. It’s given us a unique position in the market - we’re the only technology that gives you full visibility into the performance of your container-native applications, without bloating each of your containers with a monitoring agent or requiring you to instrument your code.
But that alone isn't enough to understand the logical architecture of your applications and services as they are deployed into your production environment. That's where an orchestration tool comes in.
Openshift leverages kubernetes as a container orchestration tool. If you're not familiar with kubernetes check out our introductory blog here. In short Openshift by way of kubernetes possess the details of how your containers are deployed in order to map the physical deployment of containers to the logical services that you are running. (By the way, Sysdig’s open source project for linux and container troubleshooting also supports Kubernetes.)
Sysdig leverages a deep integration with kubernetes to map your monitoring metrics from individual containers up to the applications and services that you actually want to monitor. We use metadata about your pods, replication controllers, and even any custom metadata to give you a way to monitor the actual applications that are deployed across many containers.
An Example: From Hosts and Containers to Services with OpenShift
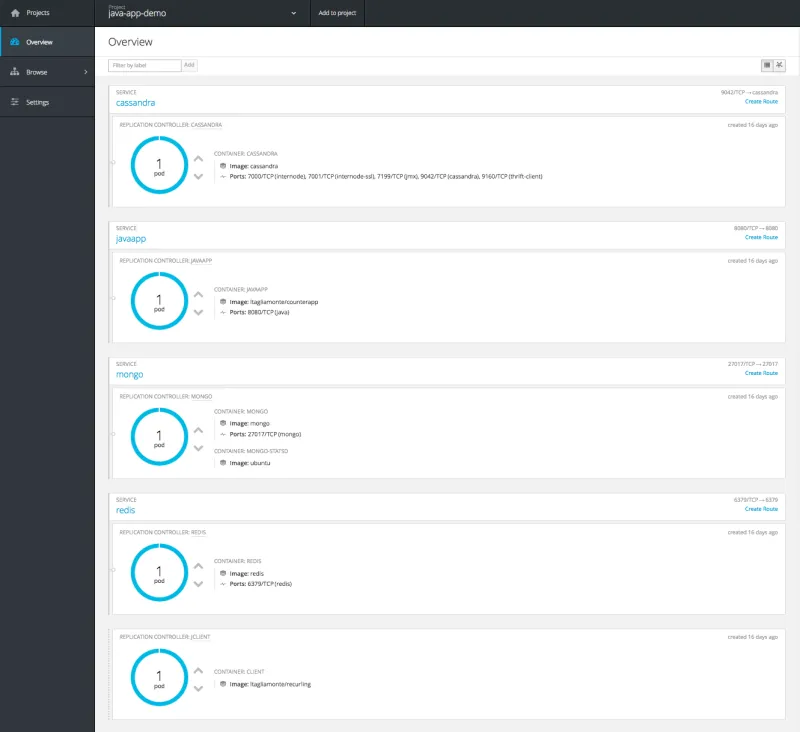
Let’s look at a quick example to make this more concrete. I’ve deployed a set of services onto a single host. For visualizing the environment we’ll use Sysdig Cloud. For the sake of this example I’m going to pack this host with Openshift, a sample “java app”, a sample “wordpress app” and of course, the sysdig cloud agent. We’ll also have some synthetic clients here to generate a bit of activity. Yeah, you probably wouldn’t be doing this in production, but it’s useful to see the power of our OpenShift integration. Here’s a view of our projects within OpenShift:

And if you dig into a given project, say “java-app” you can see the services that are deployed via kubernetes. In fact in the OpenShift UI it calls out the replication controller (essentially the kubernetes metadata) used to identify the service:

OK, now we’re up and running. Let’s talk about monitoring these services.
The screenshots below come from our OpenShift environment (“demo-openshift”), but you’ll also see multiple references to Kubernetes. That’s because OpenShift packages up Kubernetes in order to orchestrate containers.
To start, we see some basic performance details like CPU, memory and network of the host.

The host has a number of containers running on it. Drilling down on the hosts, we see the containers themselves:

Simply scanning this list of containers on a single host, I don’t see much organization to the responsibilities of these objects. For example, some of these containers run Openshift services (like origin) and we presume others have to do with the application running (like javaapp.x).
What is interesting about this view is that it gives us per-container resource utilization based on CPU shares and quota. So, if you’re looking to see which squeaky container is getting more than its fair share of resources, this will instantly tell you that. Useful - and hard to get in other monitoring tools - but still not as useful as analyzing our infrastructure on a services-level as opposed to a container-level. (Check out post, “Greed is Good”, in honor of Gordon Gekko, “Wall Street” the movie, and troubleshooting containers with Kubernetes.)
Now let’s use some of the metadata provided by Kubernetes to take an application-centric view of the system. Let’s start by creating a hierarchy of components based on labels, in this order:
Kubernetes namespace -> replication controller -> pod -> container
This aggregates containers at corresponding levels based on the above labels. In the app UI below, this aggregation and hierarchy are shown in the grey “grouping” bar above the data about our hosts. As you can see, we have a “wp-demo” namespace with a wordpress service (replication controller) below it. Each replication controller can then consist of multiple pods, which are in turn made up of containers.

In addition to organizing containers via labels, this view also aggregates metrics across relevant containers, giving a singular view into the performance of a namespace or replication controller.
In other words, with this aggregated view based on metadata, you can now start by monitoring and troubleshooting services, and drill into hosts and containers only if needed.
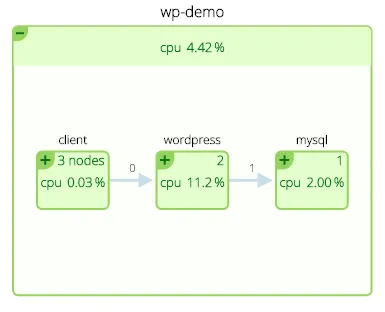
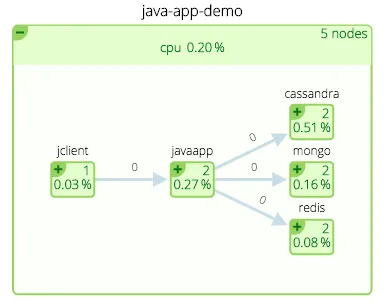
Let’s do one more thing with this environment — let’s use the metadata to create a visual representation of services and the topology of their communications. Here you see our containers organized by services, but also a map-like view that shows you how these services relate to each other.


The boxes represent services that are aggregates of containers (the number in the upper right of each box tells you how many containers), and the lines represent communications between services and their latencies.
This kind of view provides yet another logical, instead of physical, view of how these application components are working together. From here I can understand service performance, relationships and underlying resource consumption (CPU in this example).
Openshift and Sysdig - enabling the production-ready container platform
The next wave of application platforms are being built on containers and the orchestration tools that manage them. But making them production ready will also require deep application-level and service-level visibility inside containers.
We think the combination of Openshift and Sysdig will help you achieve the agility you want, while getting a new level of visibility into their applications and microservices.
We hope this post has whet your appetite to get production-grade container monitoring running in your environment. We’d love to have you take a free trial of Sysdig in honor of our new integration. Sign up here.
-- Apurva Davé is the VP of Marketing at Sysdig.
À propos de l'auteur
Plus de résultats similaires
Red Hat to acquire Chatterbox Labs: Frequently Asked Questions
Key considerations for 2026 planning: Insights from IDC
Edge computing covered and diced | Technically Speaking
Parcourir par canal
Automatisation
Les dernières nouveautés en matière d'automatisation informatique pour les technologies, les équipes et les environnements
Intelligence artificielle
Actualité sur les plateformes qui permettent aux clients d'exécuter des charges de travail d'IA sur tout type d'environnement
Cloud hybride ouvert
Découvrez comment créer un avenir flexible grâce au cloud hybride
Sécurité
Les dernières actualités sur la façon dont nous réduisons les risques dans tous les environnements et technologies
Edge computing
Actualité sur les plateformes qui simplifient les opérations en périphérie
Infrastructure
Les dernières nouveautés sur la plateforme Linux d'entreprise leader au monde
Applications
À l’intérieur de nos solutions aux défis d’application les plus difficiles
Virtualisation
L'avenir de la virtualisation d'entreprise pour vos charges de travail sur site ou sur le cloud
