In this post:
- Learn how using Grafana in Red Hat Virtualization can help you save time and resources, free resources, optimize your workload schedule, and more!
As an administrator, it can be difficult to get the right level of visibility across your infrastructure. With the Red Hat Virtualization monitoring portal and Grafana dashboards, you can understand your data, identify problems early, utilize your resources efficiently and much more!
The portal includes 20 dashboards, and at least 150 panels to monitor the Red Hat Virtualization environment. Find more information about how to configure and use Grafana in Visualize and Monitor the Red Hat Virtualization Environment with Grafana.
You might still be asking yourself: what exactly can Grafana do in Red Hat Virtualization? In this post, we cover six ways you can use Grafana to monitor and obtain metrics and logs from your Red Hat Virtualization system. Let’s dive in.
1. It can help you save time and resources by identifying virtual machines that you can delete
The “Virtual Machines Uptime Dashboard” presents the downtime and uptime, CPUs, memory size, create date, and update date for each virtual machine (VM).
Manually, finding idle or unused workloads across thousands of VMs may take weeks and require a very large spreadsheet. Our dashboard can help you identify unused VMs based on their planned downtime, and check if they can be deleted—thus saving money.
You can also see more details on VMs that often experience unplanned downtime. Click on the VM name to see further details such as their users, disk size, and more.
2. You can use Red Hat Virtualization monitoring portal to identify datacenters and clusters that have high overcommit rates
In the “Inventory Dashboard,” you can see the running VMs in each datacenter and in each cluster of your environment, including resource overcommit rates for the VMs.
You can see whether the resource allocation is balanced and whether resources should be removed or added across datacenters and clusters.

3. You’re able to assess current data storage needs
Inadequate storage space can cause processes to fail and can be expensive if not managed properly. Luckily, we have a monitoring solution just for that.
The “Storage Domain Inventory” dashboard” is where you can find the domain type, storage type, available disk size, and used disk size. When you specify a maximum GB size, the dashboard will filter to all storage domains that are smaller than that size so that you can see the most used or unused storage domains and allocate available space accordingly between the storage domains.
The dashboard helps you avoid lack of space to achieve optimal performance.
4. Red Hat Virtualization monitoring portal can identify VMs with open sessions that can be closed
Most environments have a large number of VMs—even if each machine consumes few resources, together they can add up and consume a huge amount. To prevent this waste, we should identify the unused machines as soon as possible.
In the “Executive Dashboard,” you can identify VM sessions with high average resource usage and see their session length according to the selected time range.
You can click on the name of the VM and see further details such as which users used the VM and when.
5. It can optimize your workload schedule
Red Hat Virtualization monitoring portal also has a “Hosts/Virtual Machines Resource Usage Dashboard,” where you can identify busy days and hours of resource consumption (memory and CPU usage).
With this dashboard, you can see if your workloads can be distributed more efficiently according to day of the week and hour of the day. In addition, you can use it to identify the most convenient times for maintenance and control processes.
6. You can navigate easily to find the dashboard relevant to your needs
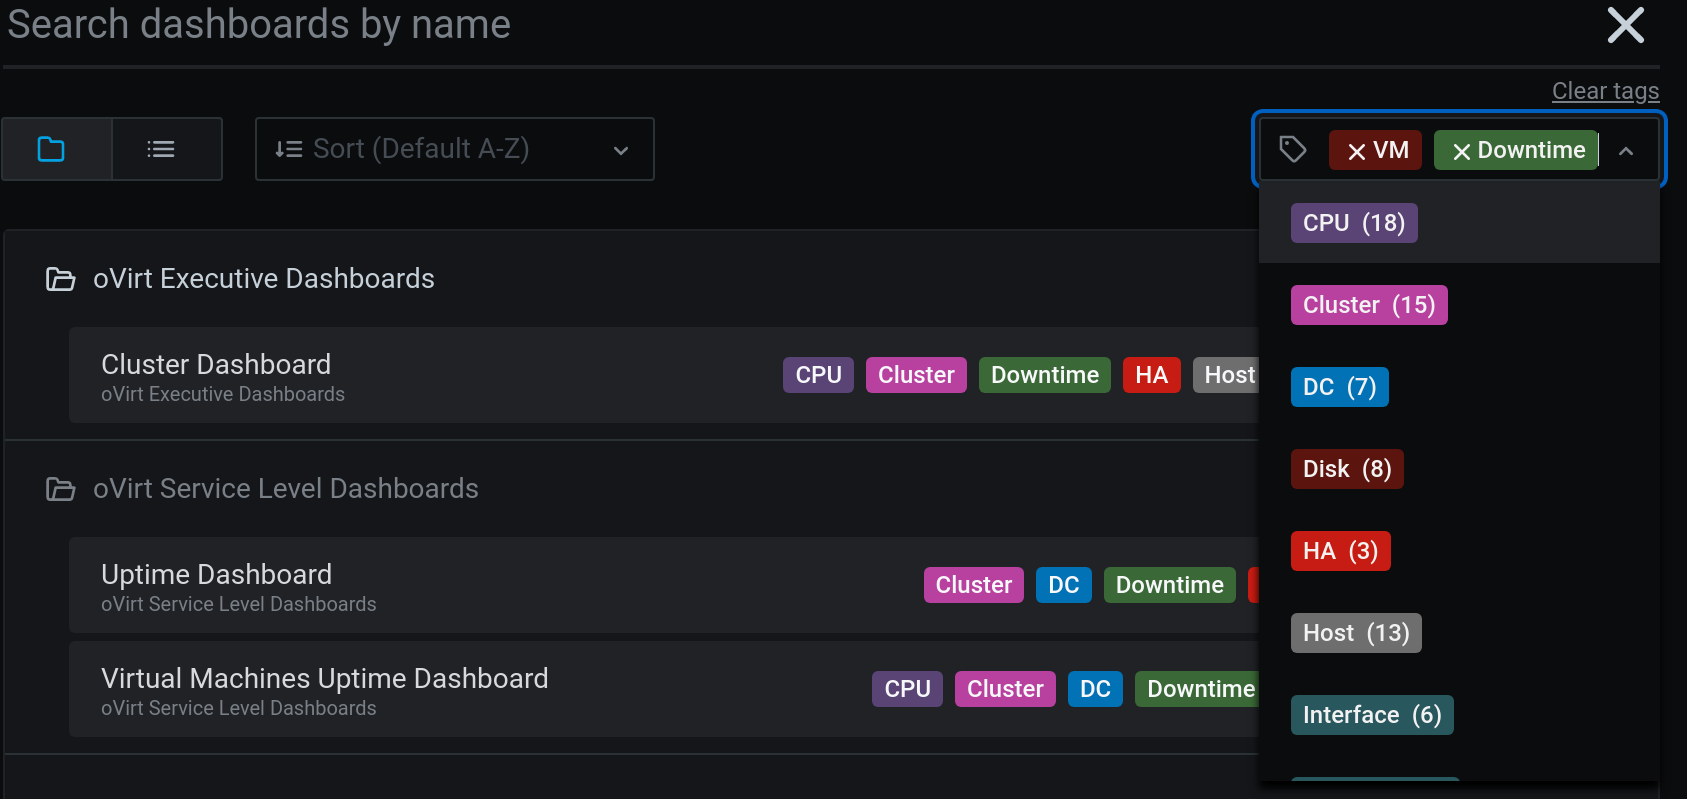
As mentioned earlier, there are many Grafana dashboards for different topics within the Red Hat Virtualization monitoring portal. It can be difficult to find the dashboard that contains the information you are looking for. With the help of tags, you can easily filter the available dashboards.
For example, if you want to find data about VM downtime, use preset tags like “VM” and “Downtime.”

Where can I learn more about Grafana?
That wraps up our Grafana recap. If you find the Red Hat Virtualization Monitoring portal useful or have feedback, open a support case on the Red Hat Customer Portal.
For additional information, check out these resources:
-
Enabling Grafana integration manually: Configuring Grafana.
-
Full dashboards descriptions can be found in the Administration Guide: Built-in Grafana dashboards.
-
The data available in the data warehouse: Statistics History Views, Configuration History Views.
Sobre o autor
Litman has been with Red Hat since 2020 and is currently an Associate Software Engineer.
Mais como este
Navigating the Mythos-haunted world of platform security
Managed identity in Azure Red Hat OpenShift portal
Collaboration In Product Security | Compiler
Keeping Track Of Vulnerabilities With CVEs | Compiler
Navegue por canal
Automação
Últimas novidades em automação de TI para empresas de tecnologia, equipes e ambientes
Inteligência artificial
Descubra as atualizações nas plataformas que proporcionam aos clientes executar suas cargas de trabalho de IA em qualquer ambiente
Nuvem híbrida aberta
Veja como construímos um futuro mais flexível com a nuvem híbrida
Segurança
Veja as últimas novidades sobre como reduzimos riscos em ambientes e tecnologias
Edge computing
Saiba quais são as atualizações nas plataformas que simplificam as operações na borda
Infraestrutura
Saiba o que há de mais recente na plataforma Linux empresarial líder mundial
Aplicações
Conheça nossas soluções desenvolvidas para ajudar você a superar os desafios mais complexos de aplicações
Virtualização
O futuro da virtualização empresarial para suas cargas de trabalho on-premise ou na nuvem
