One of the main challenges that system administrators, developers, and others face when running workloads on Red Hat Enterprise Linux (RHEL) is how to optimize performance by properly sizing systems, understanding utilization, and addressing issues that arise. In order to make data-driven decisions about these topics, performance metrics must be recorded and accessible by the administrator or developer.
Performance metric tracking with Performance Co-Pilot (PCP) and Grafana can be useful in almost any RHEL environment. However, the process to get it set up across a large number of hosts might seem daunting at first. This is why Red Hat introduced a Metrics System Role, which automates the configuration of performance metrics. I’ll show you how in this post.
The background
Before we jump into the demonstration, let’s cover a few basics. RHEL System Roles are a collection of Ansible roles and modules that are included in RHEL to help provide consistent workflows and streamline the execution of manual tasks. The Metrics System Role helps you visualize performance metrics across your RHEL environment more quickly and more easily.
Red Hat supports the Performance Co-Pilot (PCP) toolkit as part of RHEL to collect performance metrics, and Grafana to visualize the data. If you aren’t already familiar with PCP and Grafana, please refer to the series that Karl Abbott published recently, in particular part 1 and part 2, which provide an overview of these tools. In addition, the RHEL performance post series page is a hub for our RHEL performance related posts.
Environment overview
In my example environment, I have a control node system named controlnode running RHEL 8, and four managed nodes (two running RHEL 8, two running RHEL 7).

In this example, I would like to install, configure, and start recording performance metrics on all five of these hosts using PCP. I would also like to install and configure Grafana on the control node system, and have the performance metrics from all five servers be viewable within Grafana.
I’ve already set up an Ansible service account on the five servers, named ansible, and have SSH key authentication set up so that the ansible account on controlnode can log in to each of the systems. In addition, the ansible service account has been configured with access to the root account via sudo on each host. I’ve also installed the rhel-system-roles and ansible packages on controlnode. For more information on these tasks, refer to the Introduction to RHEL System Roles post.
In this environment, I’m using a RHEL 8 control node, but you can also use Ansible Tower as your RHEL system role control node. Ansible Tower provides many advanced automation features and capabilities that are not available when using a RHEL control node. For more information on Ansible Tower and its functionality, refer to this overview page.
Defining the inventory file and role variables
I need to define an Ansible inventory to list and group the five hosts that I want the metrics system role to configure.
From the controlnode system, the first step is to create a new directory structure:
[ansible@controlnode ~]$ mkdir -p metrics/group_vars
These directories will be used as follows:
-
metrics directory will contain the playbook and the inventory file.
-
metrics/group_vars will define Ansible group variables that will apply to the groups of hosts that were defined in the inventory file.
I’ll create the main inventory file at metrics/inventory.yml with the following content:
all:
  children:
    servers:
      hosts:
        rhel8-server1:
        rhel8-server2:
        rhel7-server1:
        rhel7-server2:
    metrics_monitor:
      hosts:
        controlnode:
This inventory lists the five hosts, and groups them into two groups:
-
servers group contains the rhel8-server1, rhel8-server2, rhel7-server1, and rhel7-server2 hosts.
-
metrics_monitor group contains the controlnode host.
README.md file for the metrics role, available at /usr/share/doc/rhel-system-roles/metrics/README.md contains important information about the role, including a list of available role variables and how to use them. I’ll create a file to define variables for the four systems listed in the servers inventory group by creating a file at metrics/group_vars/servers.ymlwith the following content:
metrics_retention_days: 7
The metrics_retention_days variable set to 7 will cause the metrics role to configure PCP on the systems in our servers inventory group, and retain the historical performance data for seven days.
Next, I’ll create a file that will define variables for the one system listed in the metrics_monitor inventory group by creating a file at metrics/group_vars/metrics_monitor.yml with the following content:
metrics_graph_service: yes
metrics_query_service: yes
metrics_retention_days: 7
metrics_monitored_hosts:  "{{ groups['servers'] }}"
The metrics_graph_service and metrics_query_service variables instruct the role to set up Grafana and Redis, respectively. The metrics_retention_days causes seven days of historical performance data to be retained, the same as was set up in the server's group_vars file.
The metrics_monitored_hosts variable needs to be set to the list of remote hosts that should be viewable in Grafana. Rather than listing out the hosts here, I reference the groups['servers'] variable, which contains the list of hosts defined in the servers inventory group.
Creating the playbook
The next step is creating the playbook file. The metrics README.md file notes that the role does not configure firewall rules, so in addition to calling the metrics role, I’ll also need to have tasks to configure the firewall rules.
I’ll create the playbook at metrics/metrics.yml with the following content:
- name: Open Firewall for pmcd
  hosts: servers
  tasks:
    - firewalld:
        service: pmcd
        permanent: yes
        immediate: yes
        state: enabled

- name: Open Firewall for grafana
  hosts: metrics_monitor
  tasks:
    - firewalld:
        service: grafana
        permanent: yes
        immediate: yes
        state: enabled

- name: Use metrics system role to configure PCP metrics recording
  hosts: servers
  roles:
    - redhat.rhel_system_roles.metrics

- name: Use metrics system role to configure Grafana
  hosts: metrics_monitor
  roles:
    - redhat.rhel_system_roles.metrics
The first task, Open Firewall for pmcd, opens the pmcd service in the firewall on the four systems listed in the servers inventory group.
The Open Firewall for grafana task opens the grafana service in the firewall on the single system in the metrics_monitor inventory group (the controlnode host).
The next task, Use metrics system role to configure PCP metrics recording, only applies to the four hosts in the servers inventory group, and calls the metrics system role. Based on the metrics/group_vars/servers.yml variables, this causes PCP to be configured on each of these four hosts, with performance metrics being retained for seven days.
The final task, Use metrics system role to configure Grafana, only applies to the single host in the metrics_monitor inventory group (the controlnode host). The metrics/group_vars/metrics_monitor.yml variables causes Grafana and Redis to be configured, PCP to be configured with a seven-day retention period, and PCP to also be configured to monitor the four other servers.
If you are using Ansible Tower as your control node, you can import this Ansible playbook into Ansible Automation Platform by creating a Project, following the documentation provided here. It is very common to use Git repos to store Ansible playbooks. Ansible Automation Platform stores automation in units called Jobs which contain the playbook, credentials and inventory. Create a Job Template following the documentation here.
Workaround for BZ 1967335
At the time of this writing, when using the rhel-system-roles RPM on RHEL 8.4, there is a bug (BZ 1967335) that causes issues with setting up remote PCP monitoring. We are working on a fix targeting RHEL 8.5.
If using the rhel-system-roles RPM on RHEL 8.4 or lower, run the following sed commands to workaround the issue.
[ansible@controlnode ~]$ sudo sed -i 's/__pcp_target_hosts/pcp_target_hosts/' /usr/share/ansible/collections/ansible_collections/redhat/rhel_system_roles/roles/private_metrics_subrole_pcp/tasks/pmlogger.yml

[ansible@controlnode ~]$ sudo sed -i 's/__pcp_target_hosts/pcp_target_hosts/' /usr/share/ansible/roles/rhel-system-roles.metrics/roles/pcp/tasks/pmlogger.yml
Running the playbook
At this point, everything is in place, and I’m ready to run the playbook. If you are using Ansible Tower as your control node, you can launch the job from the Tower Web interface. For this demonstration I’m using a RHEL control node and will run the playbook from the command line. I’ll use the cd command to move into the metrics directory, and then use the ansible-playbook command to run the playbook.
[ansible@controlnode ~]$ cd metrics
[ansible@controlnode metrics]$ ansible-playbook metrics.yml -b -i inventory.yml
I specify that the metrics.yml playbook should be run, that it should escalate to root (the -b flag), and that the inventory.yml file should be used as my Ansible inventory (the -i flag).
After the playbook completed, I verified that there were no failed tasks:

I also ran the pcp command and validated that I see all five hosts under the pmlogger and pmie sections of the output. The Performance Metrics Inference Engine (pmie) evaluates rules using metrics at regular intervals, and takes actions (such as writing warnings to the system log) when any rule evaluates to true. It might take a few minutes for all the hosts to show up in the pcp output.

In my testing, I found that it is necessary to restart the pmlogger and pmproxy services on the Grafana host at this point to ensure Grafana functions properly. This issue is being tracked in BZ 1978357. The services can be restarted with this command:
[ansible@controlnode metrics]$ sudo systemctl restart pmlogger pmproxy
Logging in to Grafana
I can now log in to Grafana through a web browser by accessing the Grafana servers host name on port 3000, which in my example will be controlnode:3000.
A Grafana login screen is presented, and you can log in with admin as the username and password.

The next screen prompts you to change the admin password to a new password. Once the admin password has been changed, the main Grafana web interface is shown.
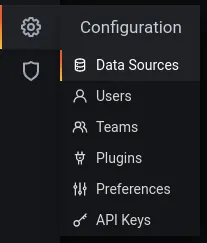
Next, I’ll access the Configuration menu on the left, and click on Data Sources.
 From the Data Sources menu, I’ll select PCP Redis.

I’ll click on the Dashboards tab, and click Import for the PCP Redis: Host Overview dashboard.

Next, I’ll go to the Dashboards menu option on the left, and click on Manage.

I’ll select the PCP Redis: Host Overview dashboard.

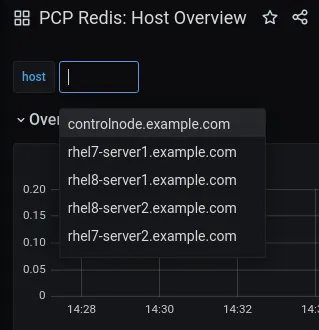
From this dashboard, I have a dropdown menu where I can select any of the five hosts in my environment:

When a host is selected, there's more than 20 various performance graphs shown. Note that it might take a couple of minutes for metrics to start showing up on your hosts if you immediately access Grafana after the metrics role is run. This is because metrics using counter semantics require at least two samples before they can be displayed, so with the default one minute sampling interval, it will take two minutes to collect the initial two samples.

Conclusion
The Metrics System Role can help you quickly and easily implement performance metrics monitoring across your RHEL environment. With this information, you’ll be better able to make data-based decisions on properly sizing systems and you’ll be able to use the data provided to better address performance issues that come up.
For more information on PCP in RHEL 8, review the monitoring and managing system status and performance chapters.
There are many other RHEL system roles that can help automate other important aspects of your RHEL environment. To explore additional roles, review the list of available RHEL System Roles and start managing your RHEL servers in a more efficient, consistent and automated manner today.
关于作者
Brian Smith is a product manager at Red Hat focused on RHEL automation and management. He has been at Red Hat since 2018, previously working with public sector customers as a technical account manager (TAM).
产品
工具
试用购买与出售
沟通
关于红帽
我们是世界领先的企业开源解决方案供应商,提供包括 Linux、云、容器和 Kubernetes。我们致力于提供经过安全强化的解决方案,从核心数据中心到网络边缘,让企业能够更轻松地跨平台和环境运营。

