OpenShift administrators often face the same challenges as other system administrators: "I need a tool that will monitor the health of my system." Yet, traditional monitoring tools often fall short in their visibility of an OpenShift cluster. Thus, a typical OpenShift monitoring stack includes Prometheus for monitoring both systems and services, and Grafana for analyzing and visualizing metrics.
Administrators are often looking to write custom queries and create custom dashboards in Grafana. However, Grafana instances provided with the monitoring stack (and its dashboards) are read-only. To solve this problem, we can use the community-powered Grafana operator provided by OperatorHub.
Red Hat nominata Leader nel Gartner® Magic Quadrant™ 2023
Grazie alla completezza della sua visione e alla sua capacità di esecuzione, Red Hat è stata nominata tra le aziende leader del Magic Quadrant™ del 2023 per la gestione dei container.
Disclaimer: Community Operators are operators which have not been vetted or verified by Red Hat. Community Operators should be used with caution because their stability is unknown. Red Hat provides no support for Community Operators.
I followed the steps below to deploy a community-powered Grafana operator 3.5.0 from OperatorHub on a running OpenShift 4.5 cluster. This allowed me to write custom queries against the built-in Prometheus to extract metrics relevant to me, and in turn I’m able to create custom dashboards to visualize those metrics.
Deploying Custom Grafana
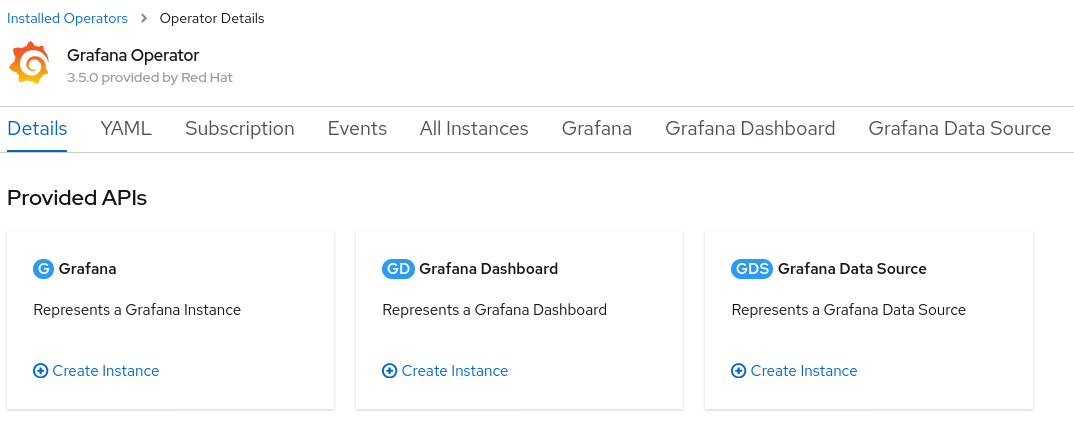
The community-powered Grafana cannot be deployed to the existing openshift-monitoring namespace, so we will create a new namespace (e.g. my-grafana) to deploy into instead. Navigate to OperatorHub and select the community-powered Grafana Operator. Press Continue to accept the disclaimer, press Install, and press Subscribe to accept the default configuration values and deploy to the my-grafana namespace. Within some time, the Grafana operator will be made available in the my-grafana namespace.

From Installed Operators, select the Grafana Operator. For the Grafana resource, press Create Instance to create a new Grafana instance.

In the Grafana instance YAML, make a note of the default username and password to log in, and press Create.
Connecting Prometheus to our Custom Grafana
The next step is to connect the community supported Grafana in the my-grafana namespace to OpenShift monitoring in the openshift-monitoring namespace.
The grafana-serviceaccount service account was created alongside the Grafana instance. We will grant it the cluster-monitoring-view cluster role.
oc adm policy add-cluster-role-to-user cluster-monitoring-view -z grafana-serviceaccountThe bearer token for this service account is used to authenticate access to Prometheus in the openshift-monitoring namespace. The following command will display this token.
oc serviceaccounts get-token grafana-serviceaccount -n my-grafanaFor new clusters in OpenShift 4.11 and above, support for the above command has been removed. Instead, a service account token secret can be created as follows:
oc create token grafana-serviceaccount --duration=8760h -n my-grafanaFrom the Grafana Data Source resource, press Create Instance, and navigate to the YAML view. In the below YAML, substitute ${BEARER_TOKEN} with the output of the command above, copy the YAML, and press Create.
apiVersion: integreatly.org/v1alpha1
kind: GrafanaDataSource
metadata:
  name: prometheus-grafanadatasource
  namespace: my-grafana
spec:
  datasources:
    - access: proxy
      editable: true
      isDefault: true
      jsonData:
        httpHeaderName1: 'Authorization'
        timeInterval: 5s
        tlsSkipVerify: true
      name: Prometheus
      secureJsonData:
        httpHeaderValue1: 'Bearer ${BEARER_TOKEN}'
      type: prometheus
      url: 'https://thanos-querier.openshift-monitoring.svc.cluster.local:9091'
  name: prometheus-grafanadatasource.yaml
Customizing Grafana
From the my-grafana namespace, navigate to Networking -> Routes and click on the Grafana URL to display the custom Grafana user interface. Click on ‘Sign In’ from the bottom left menu of Grafana, and log in using the default username and password configured earlier. Now, an editable Grafana interface appears and you can view your custom Grafana dashboards or create your own. As a note, administrators should take caution with custom dashboards to query Prometheus as this will have an impact on the performance of the monitoring stack.
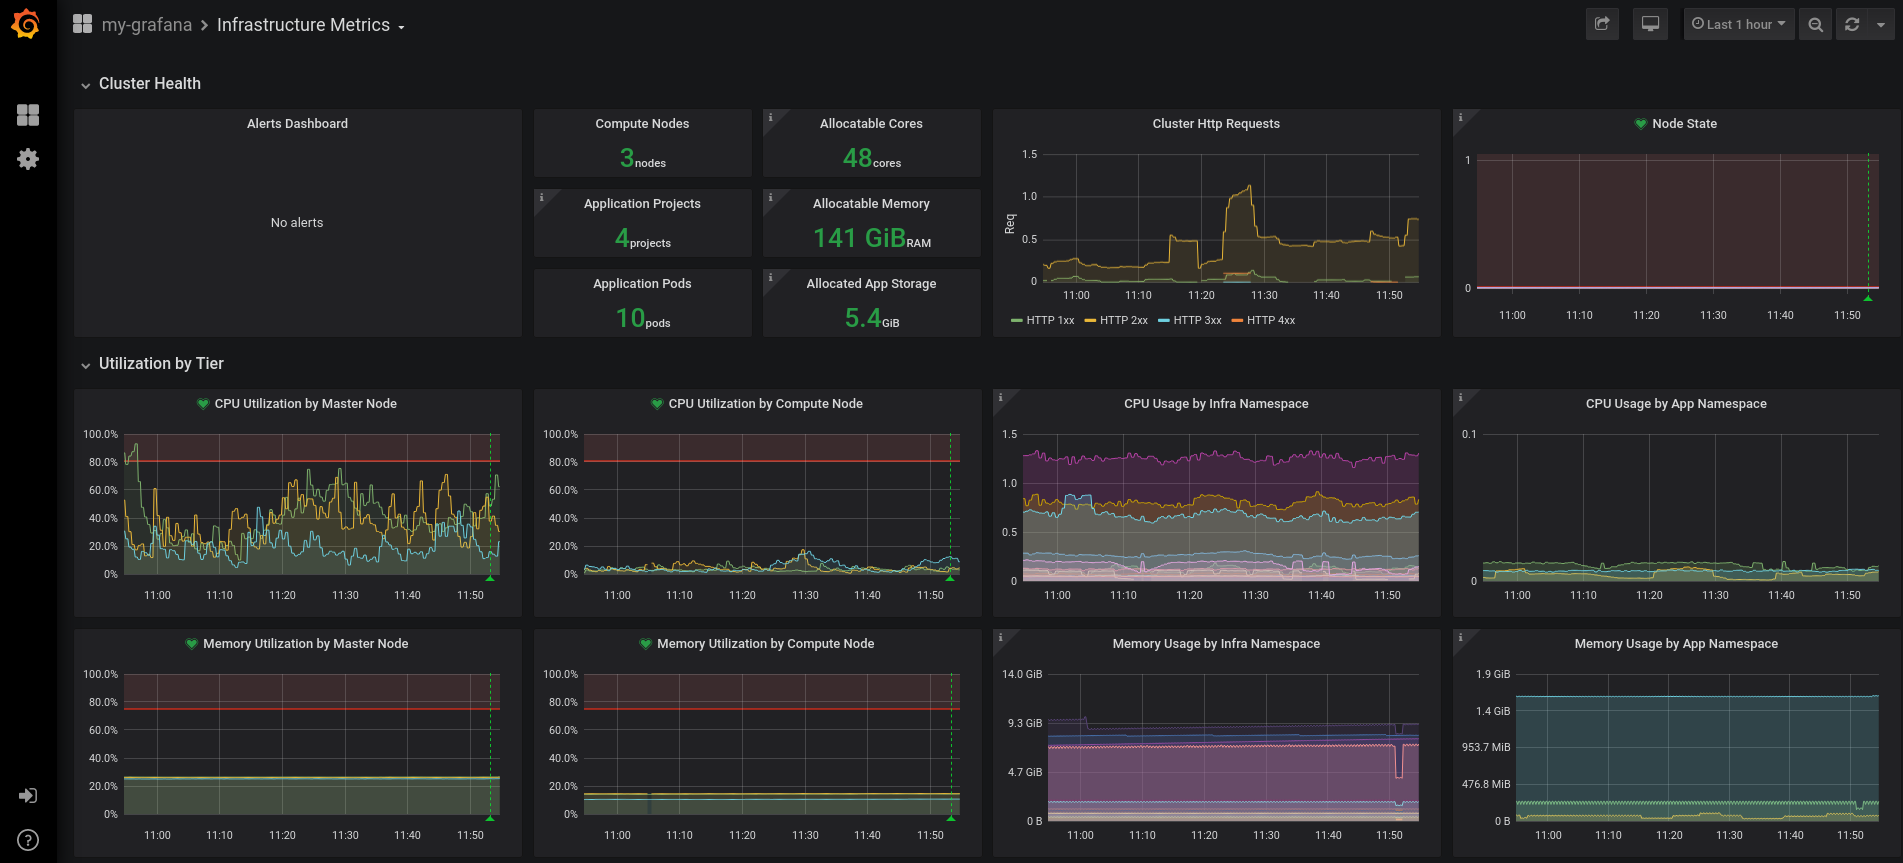
To import an existing Grafana dashboard, you can navigate from the Grafana operator menu and create a Grafana Dashboard resource. An alternative is to directly import a custom Grafana dashboard from a JSON file within Grafana. In the screenshot below, I imported a custom Grafana dashboard which displayed the custom metrics I had been looking to view.

Summary
With the community-powered Grafana, an OpenShift administrator can now write their own Prometheus queries to extract metrics and create custom dashboards to visualize the data.
Sull'autore
Kevin Chung is a Principal Architect focused on assisting enterprise customers in design, implementation and knowledge transfer through a hands-on approach to accelerate adoption of their managed OpenShift container platform.
Altri risultati simili a questo
Why developer portals matter more in the age of AI agents
Confidential Containers workshop on Microsoft Azure Red Hat OpenShift: Learn interactively
Unlocking zero-trust supply chains | Technically Speaking
Get into GitOps | Technically Speaking
Ricerca per canale
Automazione
Novità sull'automazione IT di tecnologie, team e ambienti
Intelligenza artificiale
Aggiornamenti sulle piattaforme che consentono alle aziende di eseguire carichi di lavoro IA ovunque
Hybrid cloud open source
Scopri come affrontare il futuro in modo più agile grazie al cloud ibrido
Sicurezza
Le ultime novità sulle nostre soluzioni per ridurre i rischi nelle tecnologie e negli ambienti
Edge computing
Aggiornamenti sulle piattaforme che semplificano l'operatività edge
Infrastruttura
Le ultime novità sulla piattaforma Linux aziendale leader a livello mondiale
Applicazioni
Approfondimenti sulle nostre soluzioni alle sfide applicative più difficili
Virtualizzazione
Il futuro della virtualizzazione negli ambienti aziendali per i carichi di lavoro on premise o nel cloud